
Figure 8.
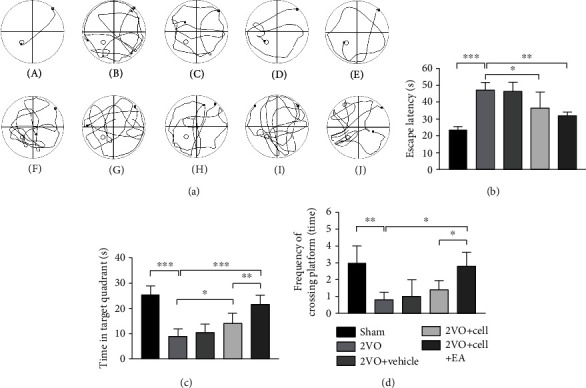
Comparison of the effects on spatial learning and memory test in rats from different groups. (a) (A–E) The swimming track of different groups of rats in spatial learning training; (F–J) the swimming track of different groups of rats in the spatial memory test. (A) and (F) from the sham group; (B) and (G) from the 2VO group; (C) and (H) from the 2VO+Vehicle group; (D) and (I) from the 2VO+Cell group; (E) and (J) from the 2VO+Cell+EA group. (b) Comparison of the average escape latencies of five groups in four days of spatial learning training (one-way ANOVA, F = 12.354, P < 0.001). (c) Comparison of the swimming time in target quadrant of five groups in the spatial memory test (one-way ANOVA, F = 22.159, P < 0.001). (d) Comparison of the frequency of crossing in the platform of five groups in the spatial memory test (one-way ANOVA, F = 8.281, P < 0.01). Values are mean ± SEM (N = 5 rats/per group). ∗P < 0.05, ∗∗P < 0.01, and ∗∗∗P < 0.001.