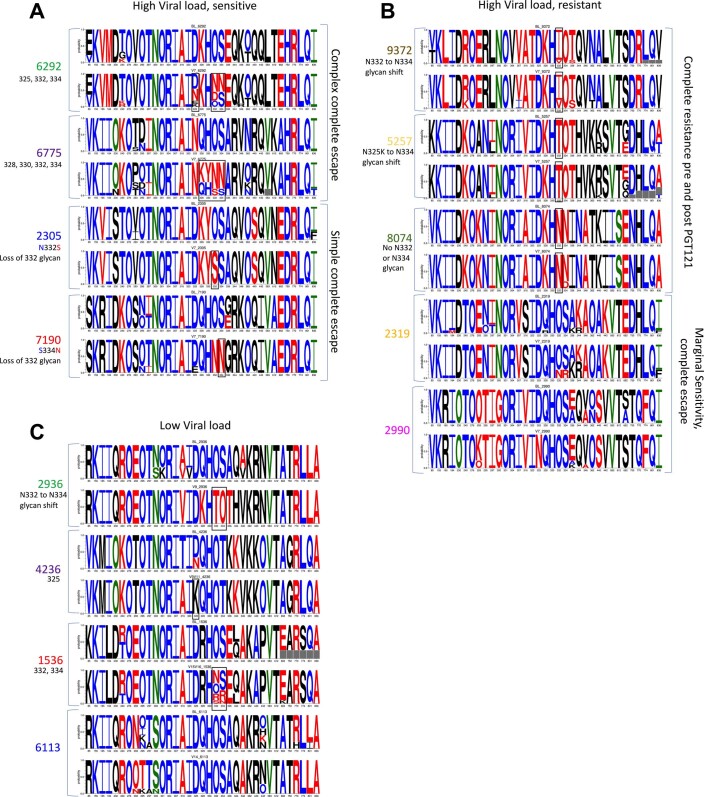
Extended Data Fig. 6. V3 glycan signatures.
Glycan signatures are displayed for participants with (a) high viral load and sensitive viruses at baseline, (b) high viral load and resistant viruses at baseline, and (c) low viral load at baseline. LOGO plots are shown representing the sensitivity and resistance mutations for all V3 glycan signatures. The height of the letter indicates the frequences the sample, for the baseline on the top, and the post PGT121 treatment directly underneath. The putative resistance conferring mutations are boxed in black. Red letters indicate resistance, blue sensitivity, green depended on the antibody, and black indicate amino acids not supported statistically as either a sensistivity or resistance signature. The signatures outside of the binding region are more likely to modulate levels of sensitivity, and are seldom perturbed.

