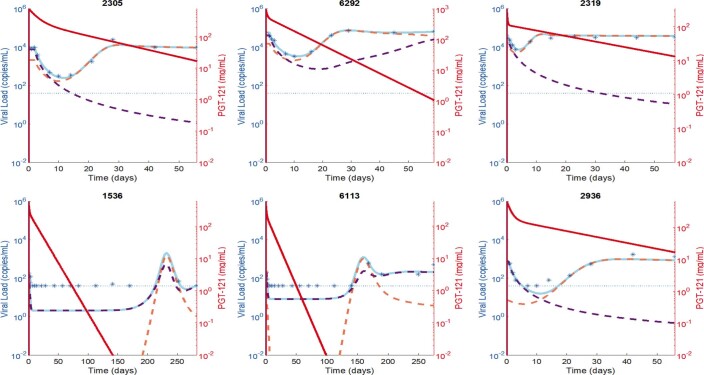
Extended Data Fig. 8. Modeling the effects of PGT121 on plasma viral load.
Best fit of viral dynamic model (light blue line) to measured viral load data (blue asterisks) for 6 participants. PGT121 serum concentration is shown in solid red. Horizontal dotted line indicates the viral load limit of detection. Participants 2990,6292 and 2305 shown in the top row belong to the high viral load group, with the remaining patients belonging to the low viral load group. The model follows two populations of virus, PGT121 sensitive and PGT121 resistant, denoted by the purple and orange dashed lines, respectively, while the total viral load is a solid light blue line. The level of resistance is allowed to vary among participants. For 2305, 2936, 2990, 6292 and 6113 the resistant population is predicted to pre-exist at the indicated levels. For the long-term controller 6113 the pre-existing resistant virus is predicted to be partially sensitive to the antibody and after PGT121 administration its level quickly decreases below the x-axis and does not reappear until after day 100. For the other long-term controller 1536, the resistant population may pre-exist at a baseline level of 10–3 copies/ml or lower or may arise by mutation. Loss of control in both 1536 and 6113 is predicted to occur due to a resurgence of resistant virus. For the periods of observation indicated, the resistant population is predicted to persist (2305, 2936 and 2990) or to be replaced by drug sensitive virus as the antibody concentration wanes in 6292 and the long-term controllers 1536 and 6113.

