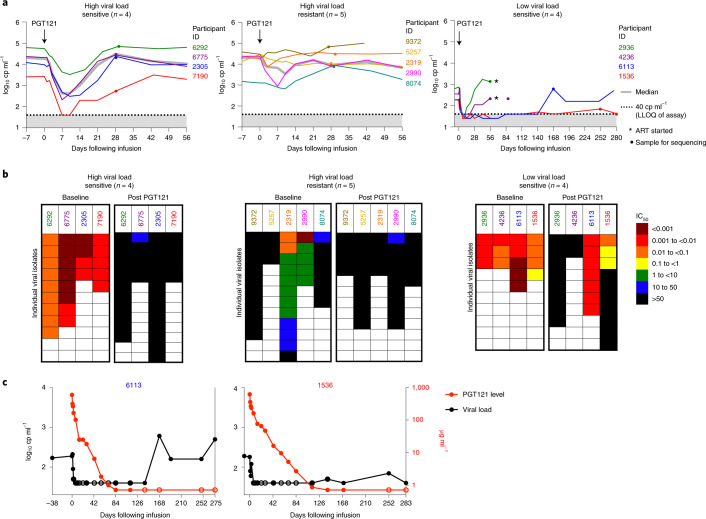
Fig. 3. HIV-1 RNA viral load and sensitivity to PGT121 before and after PGT121 infusion.
a, Plasma HIV-1 RNA levels are shown following PGT121 infusion in HIV-infected viremic participants not on ART. The arrow indicates the day of PGT121 infusion, the gray line equals median value and the dotted line indicates the lower limit of quantification for HIV-1 RNA levels (40 copies (cp) ml–1). Asterisks indicate the time point at which ART was started, and dots indicate when samples were collected for sequencing. b, IC50 neutralization scores (µg ml–1), indicating sensitivity or resistance to PGT121 among isolated viruses, are shown for each participant, before and after PGT121 administration. c, HIV-1 viral load and PGT121 serum levels are shown for participants 6113 and 1536 following PGT121 infusion. Open circles indicate that either HIV-1 RNA (black) or PGT121 level (red) was below the limit of detection.

