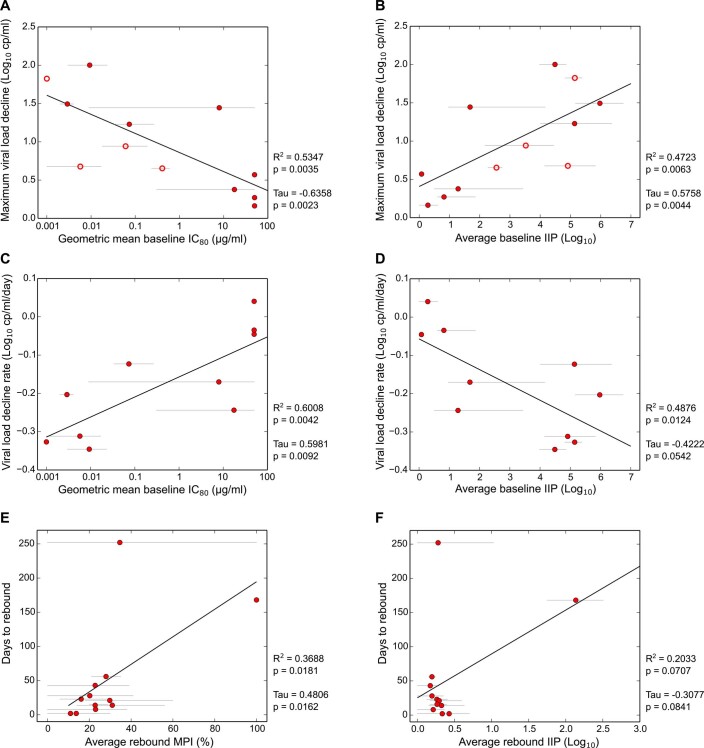
Extended Data Fig. 4. Correlation between PGT121 neutralization and viral load kinetics.
(a) Correlation between maximum viral load drop and PGT121 geometric mean IC80 titers for baseline viruses. Open symbols indicate participants whose minimum viral load was below the lower limit of quantitation (40 copies/ml). Grey lines indicate range of individual baseline virus IC80 titers. Black line is the linear regression trend line. (b) Same as (A), but using predicted average instantaneous inhibitory potential (IIP) for baseline viruses (see Methods). (c) Correlation between initial viral load decline rate and geometric mean PGT121 IC80 titers for baseline viruses. Grey lines indicate range of IC80 titers, black line the trend. See methods for initial viral load decline rate calculations. (d) Same as (C) but using average IIP as in (B). (e) Correlation between days to rebound and average maximum percent inhibition (MPI) of rebound viruses by PGT121. Because most rebound viruses had IC80 above threshold (50 µg/ml), we used MPI defined as the observed percent neutralization of each virus at 50 µg/ml. Time to rebound was calculated as the first timepoint when the viral load post infusion returns to 0.5 Log10 copies/ml below the baseline or higher. (f) Same as (E), but using average IIP for rebound viruses. In each panel, statistics using Pearson moment correlation and Kendall Tau rank test are shown. One sided p-values are reported.

