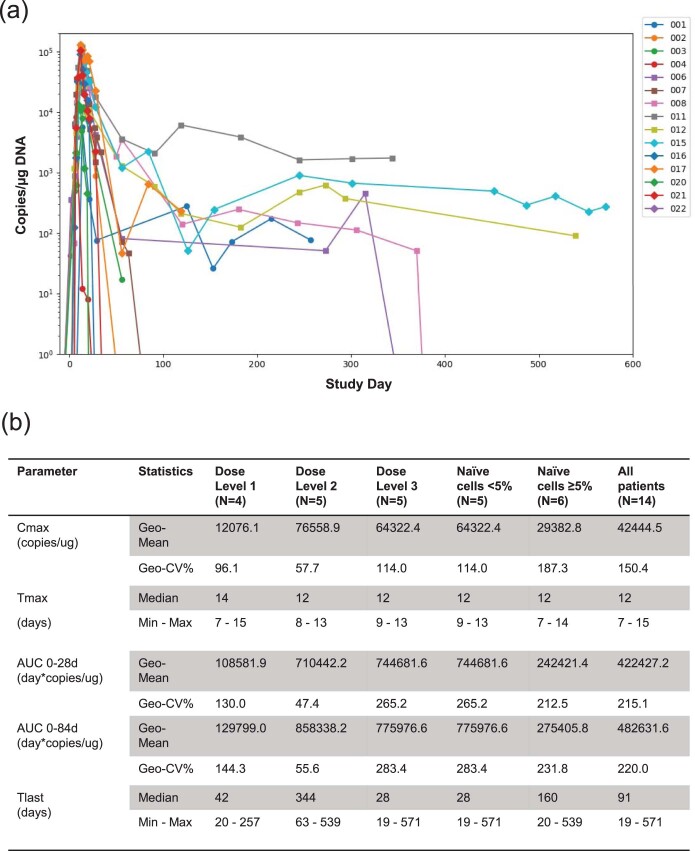
Extended Data Fig. 9. CAR T engraftment kinetics.
a) Individual concentration-time profiles for AUTO3 transgene levels by qPCR in peripheral blood post AUTO3 infusion. b) Summary of CAR T cell kinetic parameters as measured in peripheral blood by qPCR. Cmax - maximum concentration; Tmax - Time to Cmax (Days), Tlast -Time to last measurable in blood (Days), AUC - area under the curve; AUC 0-28d - AUC from time zero to day 28; AUC 0-84d - AUC from time zero to day 84; Time to Cmax is the time to reach peak CAR T cell concentration. Dose Level 1, 0.3-2 ×10⁶ cells/kg, Dose Level 2, 3×10⁶ cells/kg, Dose level 3, 4.3-5 ×10⁶ cells/kg. Of Note: 1 non-responding patient did not have any CAR-T expansion and therefore was non-evaluable for kinetic parameter derivation.

