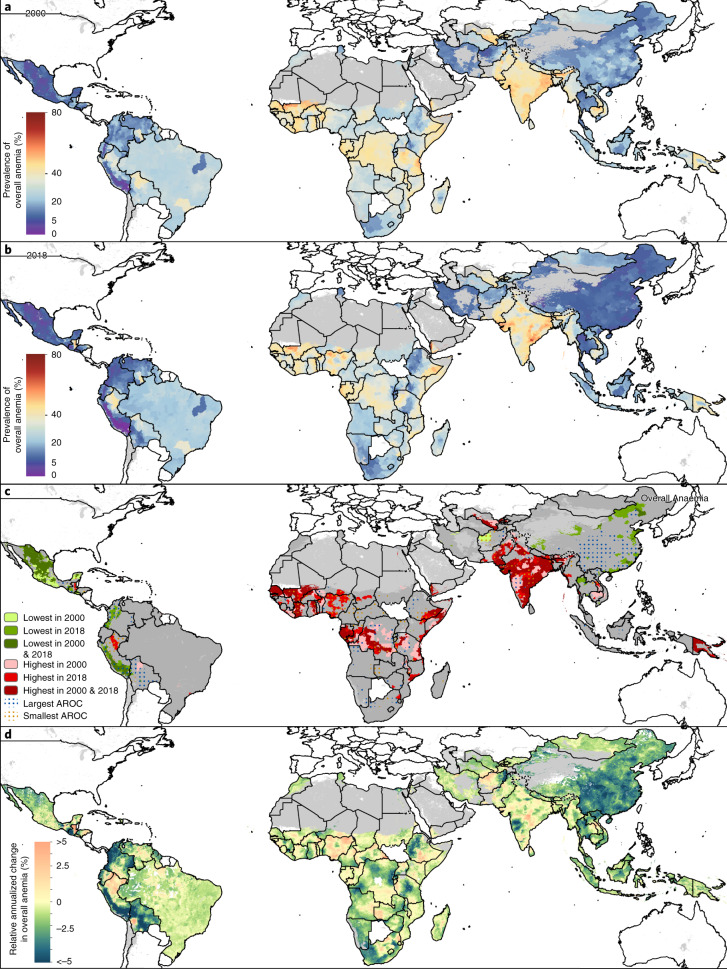
Fig. 1. Prevalence and AROCs of overall anemia in WRA (2000–2018).
a, b, Prevalence of overall anemia among WRA (ages 15–49) at the second administrative unit (for example, district) level in 2000 (a) and 2018 (b). c, Overlapping population-weighted highest and lowest (10th and 90th deciles) prevalence and AROCs between 2000 and 2018. Largest AROC indicates where largest decreases in overall anemia prevalence from 2000 to 2018 occurred, whereas smallest AROC indicates where the largest increases (or smallest decreases or stagnation) in overall anemia prevalence from 2000 to 2018 occurred. d, Weighted annualized percentage of change of overall anemia prevalence in WRA from 2000 to 2018. Maps reflect administrative boundaries, land cover, lakes and population; gray-colored grid cells had fewer than ten people per 1 × 1-km grid cell and were classified as ‘barren or sparsely vegetated’, whereas white-colored grid cells were not included in this analysis42–47.

