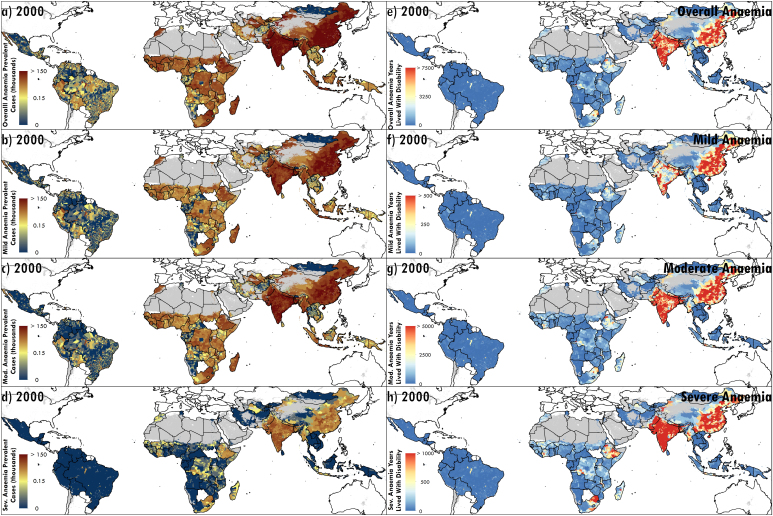
Extended Data Fig. 2. Counts and years lived with disability (YLDs) by anaemia severity among WRA in 2000.
a–d, Number of WRA across 82 LMICs with overall (a), mild (b), moderate (c), and severe anaemia (d) in 2000 by second administrative-level units. e–h, Number of years lived with disability (YLDs) among women of reproductive age (WRA) attributable to overall (e), mild (f), moderate (g), and severe anaemia (h) in 2000 by second administrative-level units. Maps reflect administrative boundaries, land cover, lakes, and population; grey-coloured grid cells had fewer than ten people per 1 × 1-km grid cell and were classified as “barren or sparsely vegetated”, while white-coloured grid cells were not included in this analysis42–47.

