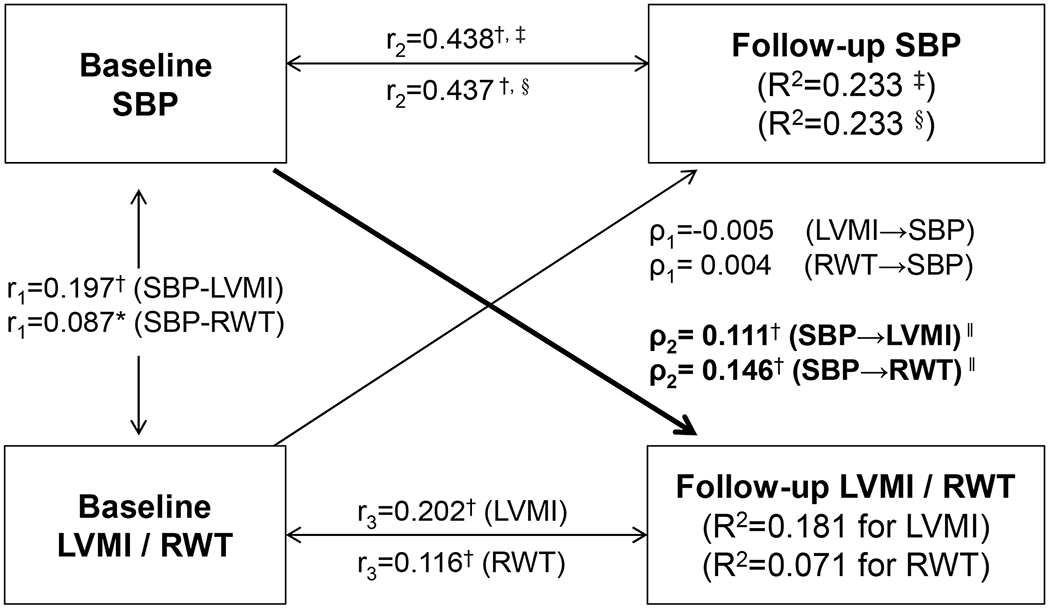
Figure 1.

Cross-lagged path analysis models of systolic blood pressure (SBP) with left ventricular mass index (LVMI) and relative wall thickness (RWT) in subjects who did not take anti-hypertensive medications
ρ1, ρ2 = cross-lagged path coefficients; r1 = synchronous correlations; r2, r3 = tracking correlations; R2 = variance explained; comparative fit index (CFI)=0.93/0.97 for LVMI/RWT; Root mean square residual (RMR)=0.03/0.02 for LVMI/RWT
Models with adjustment for age, race, sex, smoking, alcohol drinking, BMI, heart rate and follow-up years
Coefficients different from 0: * p<0.05, † p<0.01
‡, LVMI was included in the model; §, RWT was included in the model.
‖, P for difference between ρ1 and ρ2: p=0.005 for LVMI, p<0.001 for RWT
