
Figure 4:
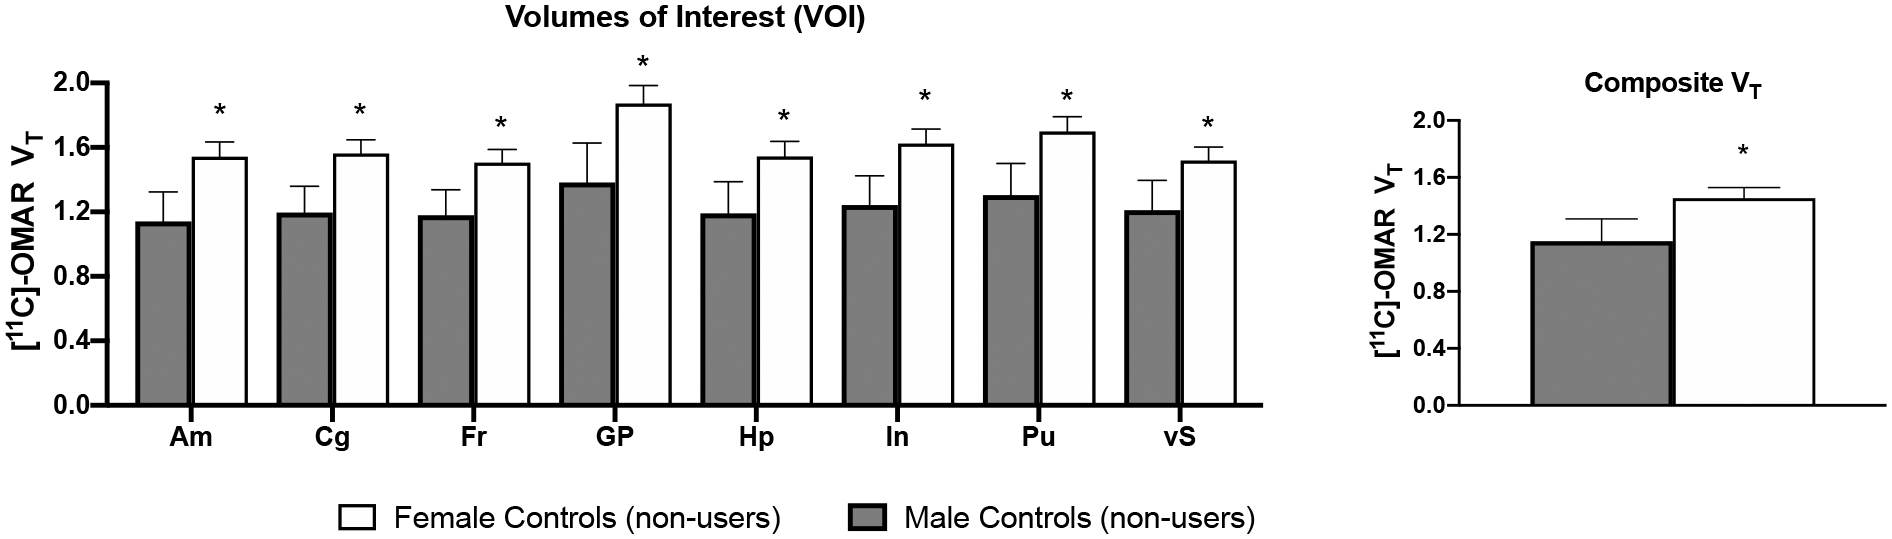
Mean (+SEM) VT values for 8 volumes of interest (VOIs) and composite VT. Asterisks (*) signify significant differences between male and female healthy controls who did not use cannabis (p<.05). On average, female controls showed a 20–26% increase in VT in the 8 VOIs and a 21% increase in composite VT compared with male controls.