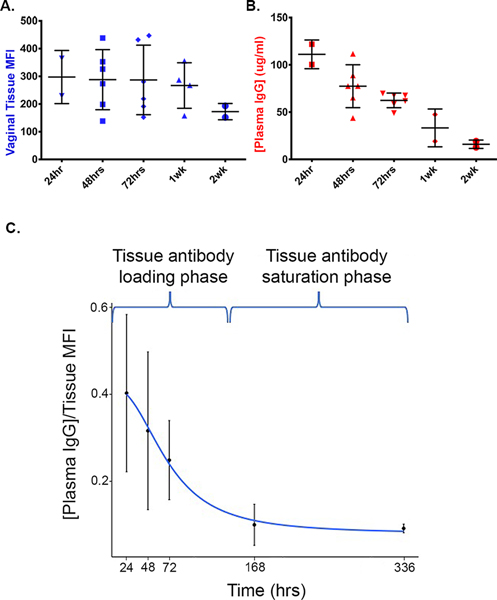
Figure 2: IV-injected fluorescently labeled antibodies persist in vaginal tissues as plasma concentration is decreased.
(A) Temporal analyses of mean fluorescent intensities (MFI) of VRC01-WT-Cy3 and VRC01-WT-Cy5 within the lamina propria of rhesus macaque vaginal tissues. Each displayed dot represents the average MFI from 11 panel images per animal from each time point. (B) Antibody concentrations for VRC01-WT-Cy3 and VRC01-WT-Cy5 over time for plasma. Each sample was run in triplicate and each displayed dot represents the average per animal from each time point. (C) The ratio of mean antibody plasma concentrations versus vaginal tissue MFI. A four-parameter log-logistic function was used as the best-fitted function to model the ratio decay (blue line).

