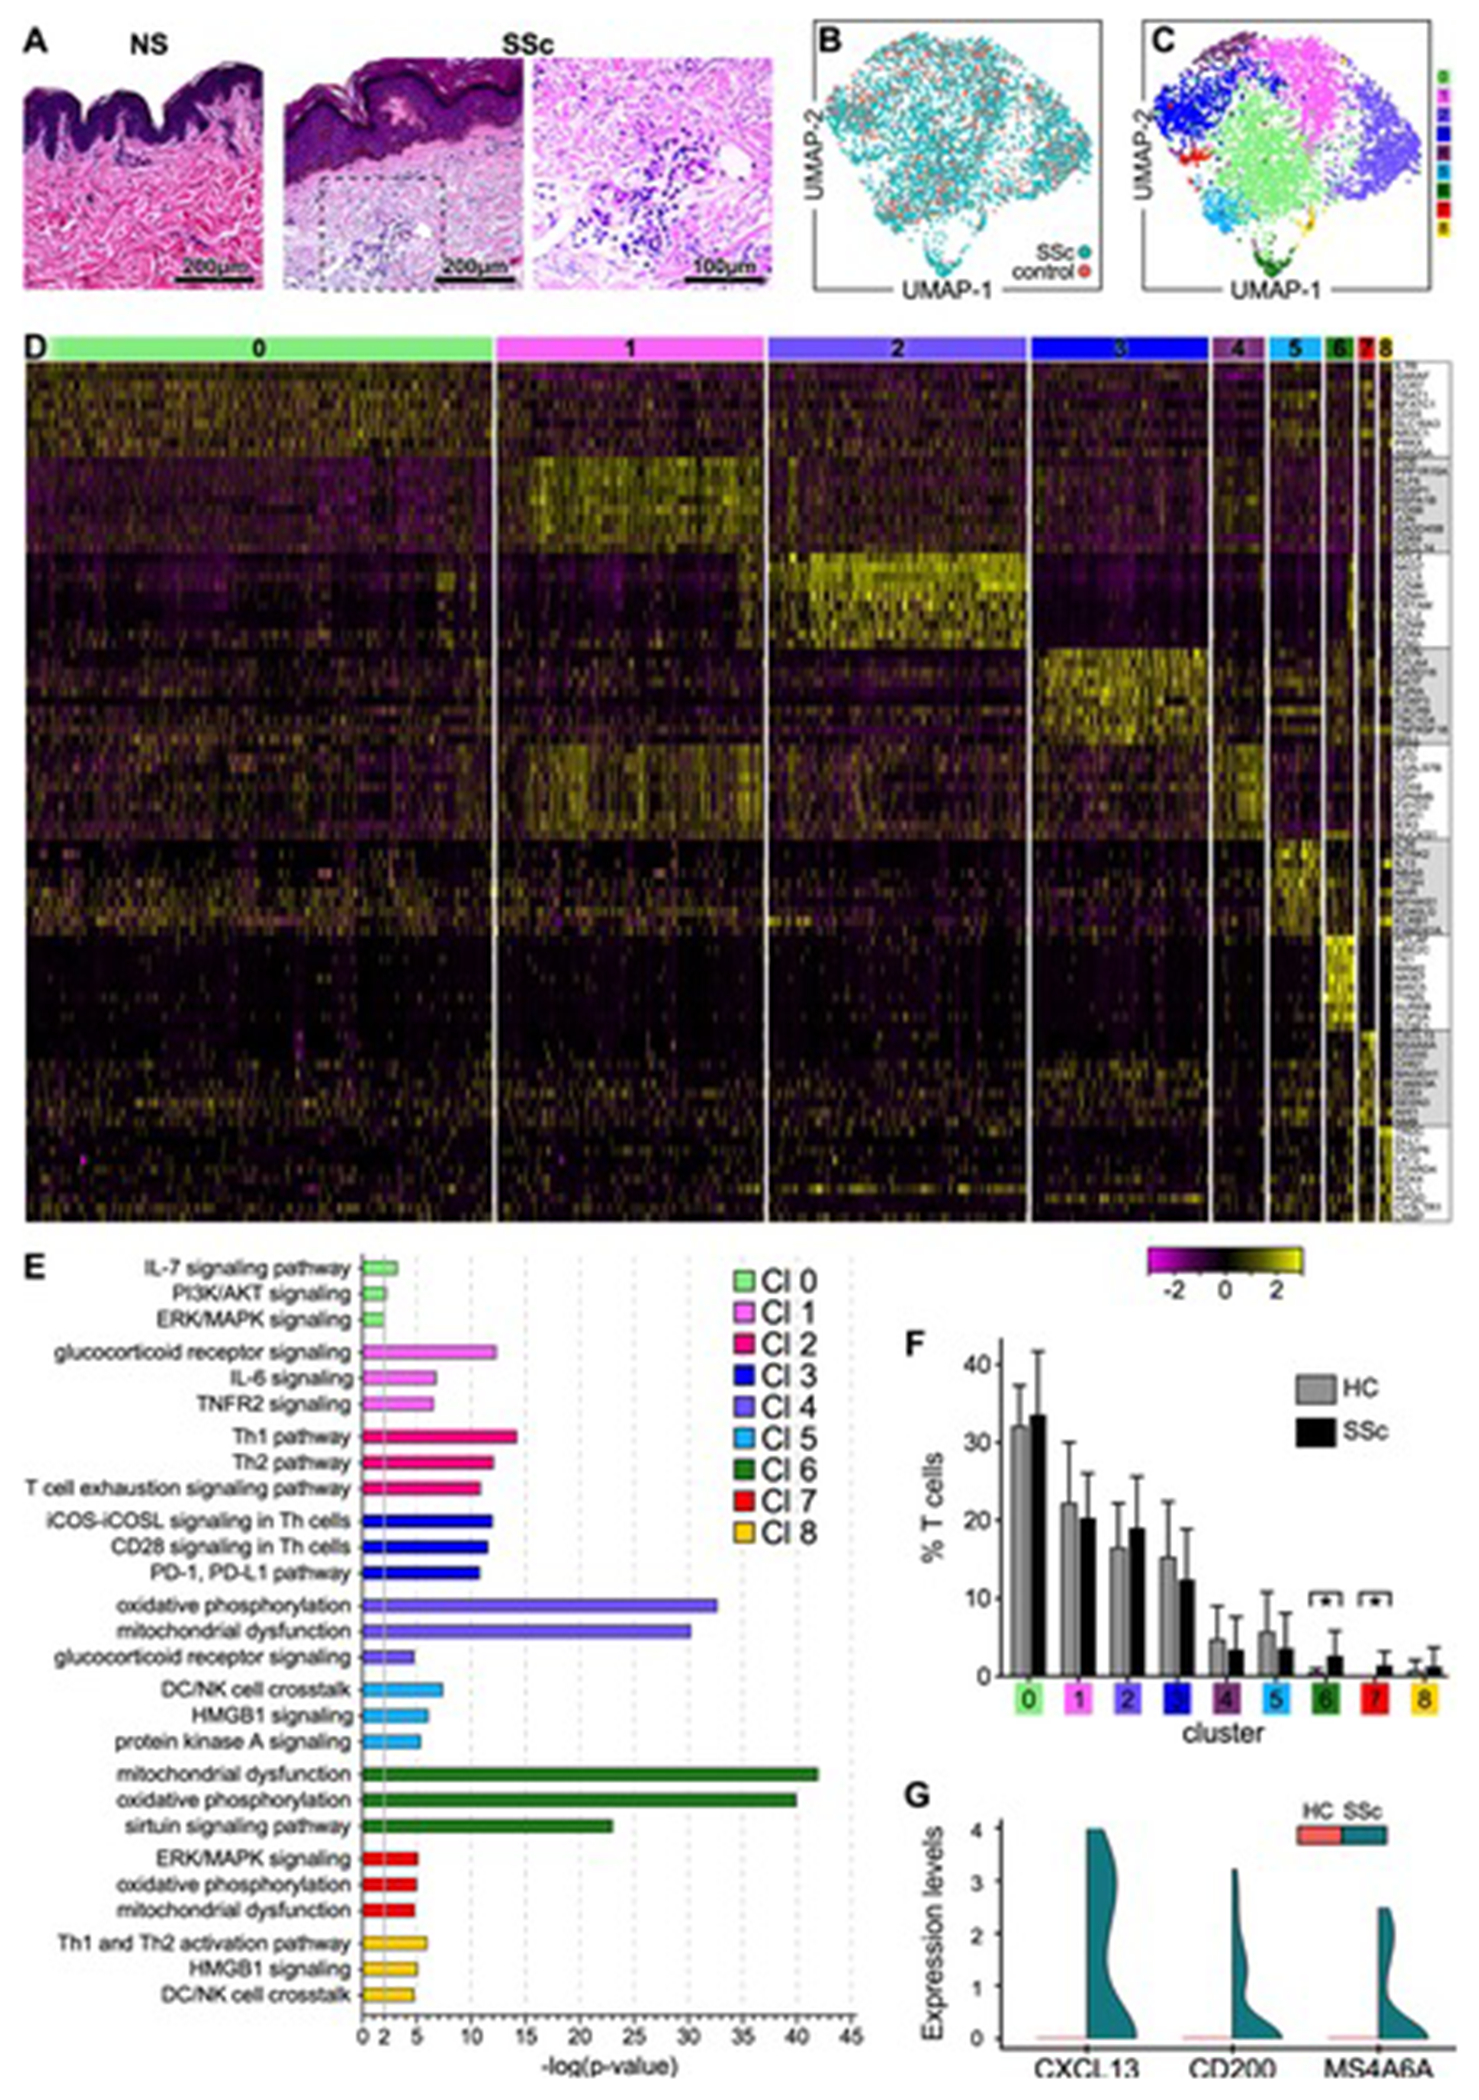
Figure 1. Transcriptional profiles of T lymphocytes from SSc and HC skin samples.

(A) Hematoxylin and eosin staining (H&E) of skin biopsies from representative healthy control (HC) and SSc skin samples analyzed by scRNA-seq (200X, 400X). (B) Transcriptomes of 3,729 CD3+ cells (867 cells from HC and 2,862 cells from SSc skin samples) (C) revealed 9 discrete Louvain clusters using Seurat.[58] (D) Heatmap showing examples of the most highly significant differentially expressed genes (n=10) for each cluster from (C). Cluster numbers are indicated at the top. Each column represents a cell. (E) Pathway analysis by Ingenuity (Qiagen). Highly significant examples of distinct pathways activated in each cluster are shown. In IPA, the pathways were compared using a P-value cut-off of 0.05. (F) Proportion of T cells from each patient or control sample within each cluster. Statistics by Mann-Whitney test. (G) Violin plot showing the expression levels of CXCL13, CD200, and MS4A6A by cells in cluster #7 comparing SSc to HC samples. SSc and HC UMAP: Uniform Manifold Approximation and Projection for dimension reduction.
