
Figure 2. Identification of resident and recirculating T cells in healthy and SSc skin.
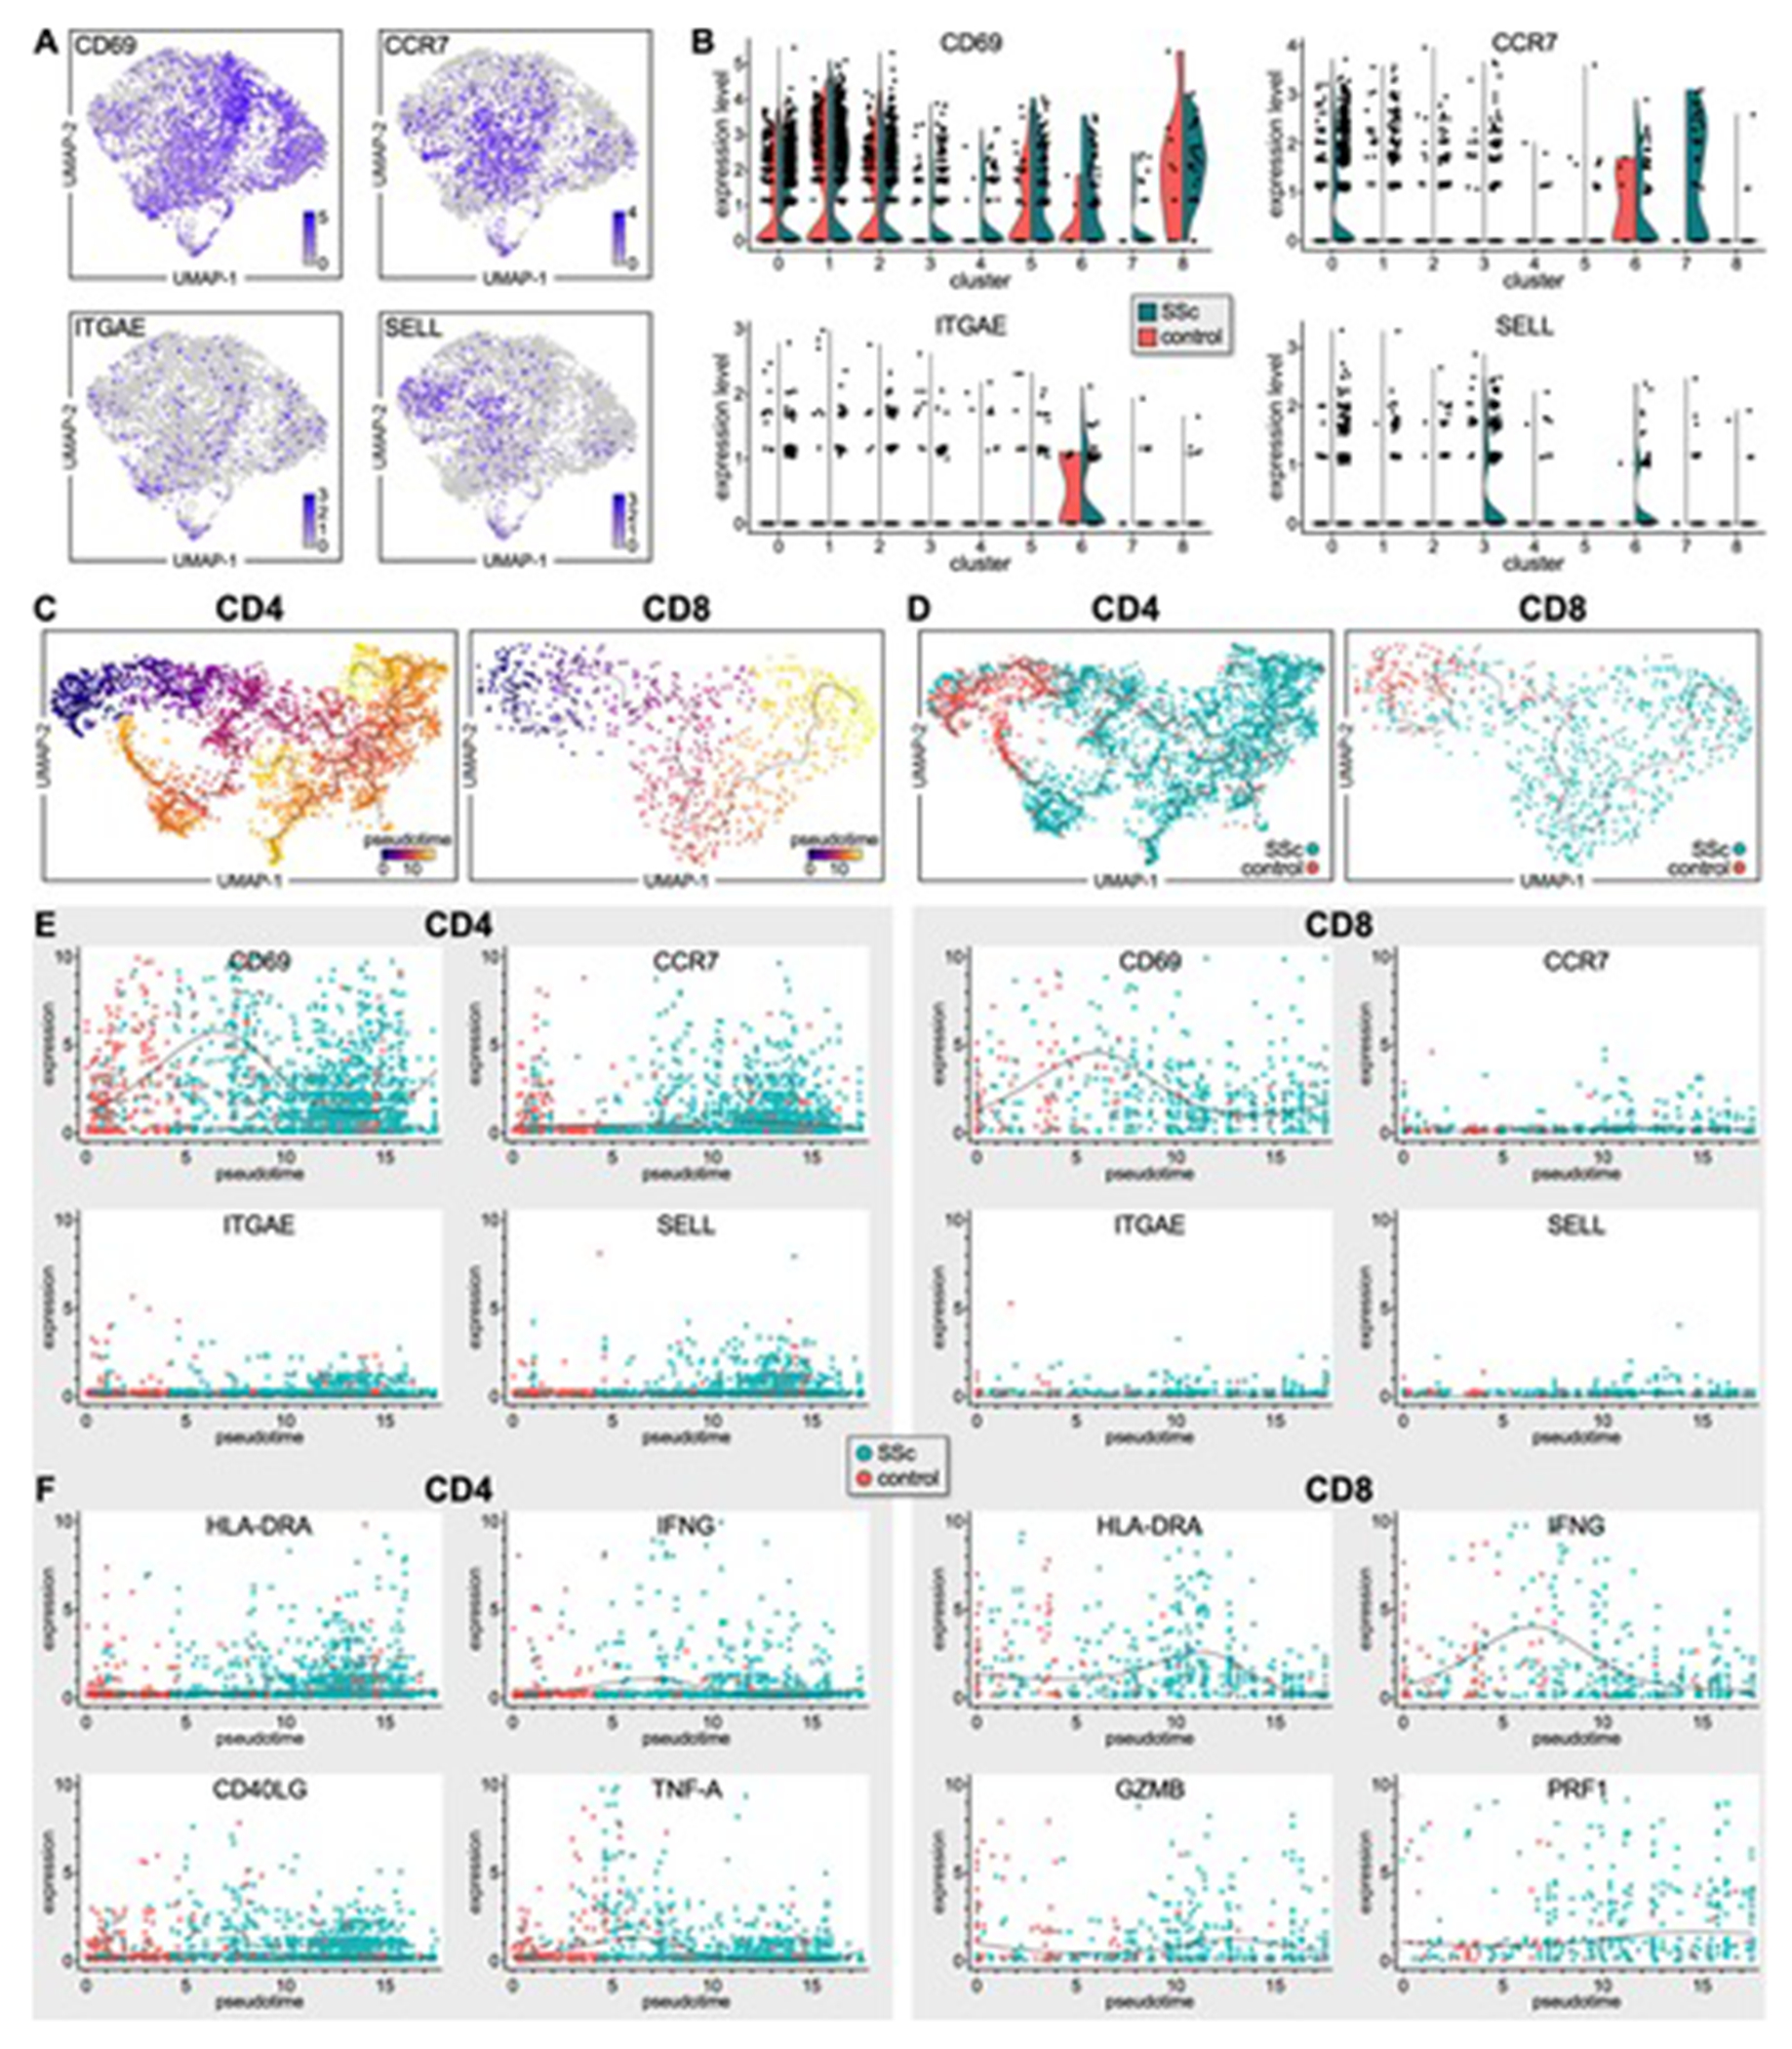
(A) Transcriptomes of CD69+, CCR7+, ITGAE+, SELL+ T lymphocytes from patient and HC skin samples. (B) Violin plots showing expression levels of CD69, CCR7, ITGAE, SELL by SSc and HC T lymphocytes from each T-cell cluster (Figure 1C). (C-D) Single-cell pseudotime trajectories of CD4+ and CD8+ T cells estimated using Monocle 3. A continuous value from 0 to 20 was assigned to each cell as a pseudotime. Expression dynamics of skin-residency (E) or T-cell activation (F) markers along the pseudotime of SSc and HC T cells by scatter plots with regression curves.