
Figure 3. Characterization of the SSc-specific CXCL13+ T-cell subset in the lesional skin of patients with active dcSSc.
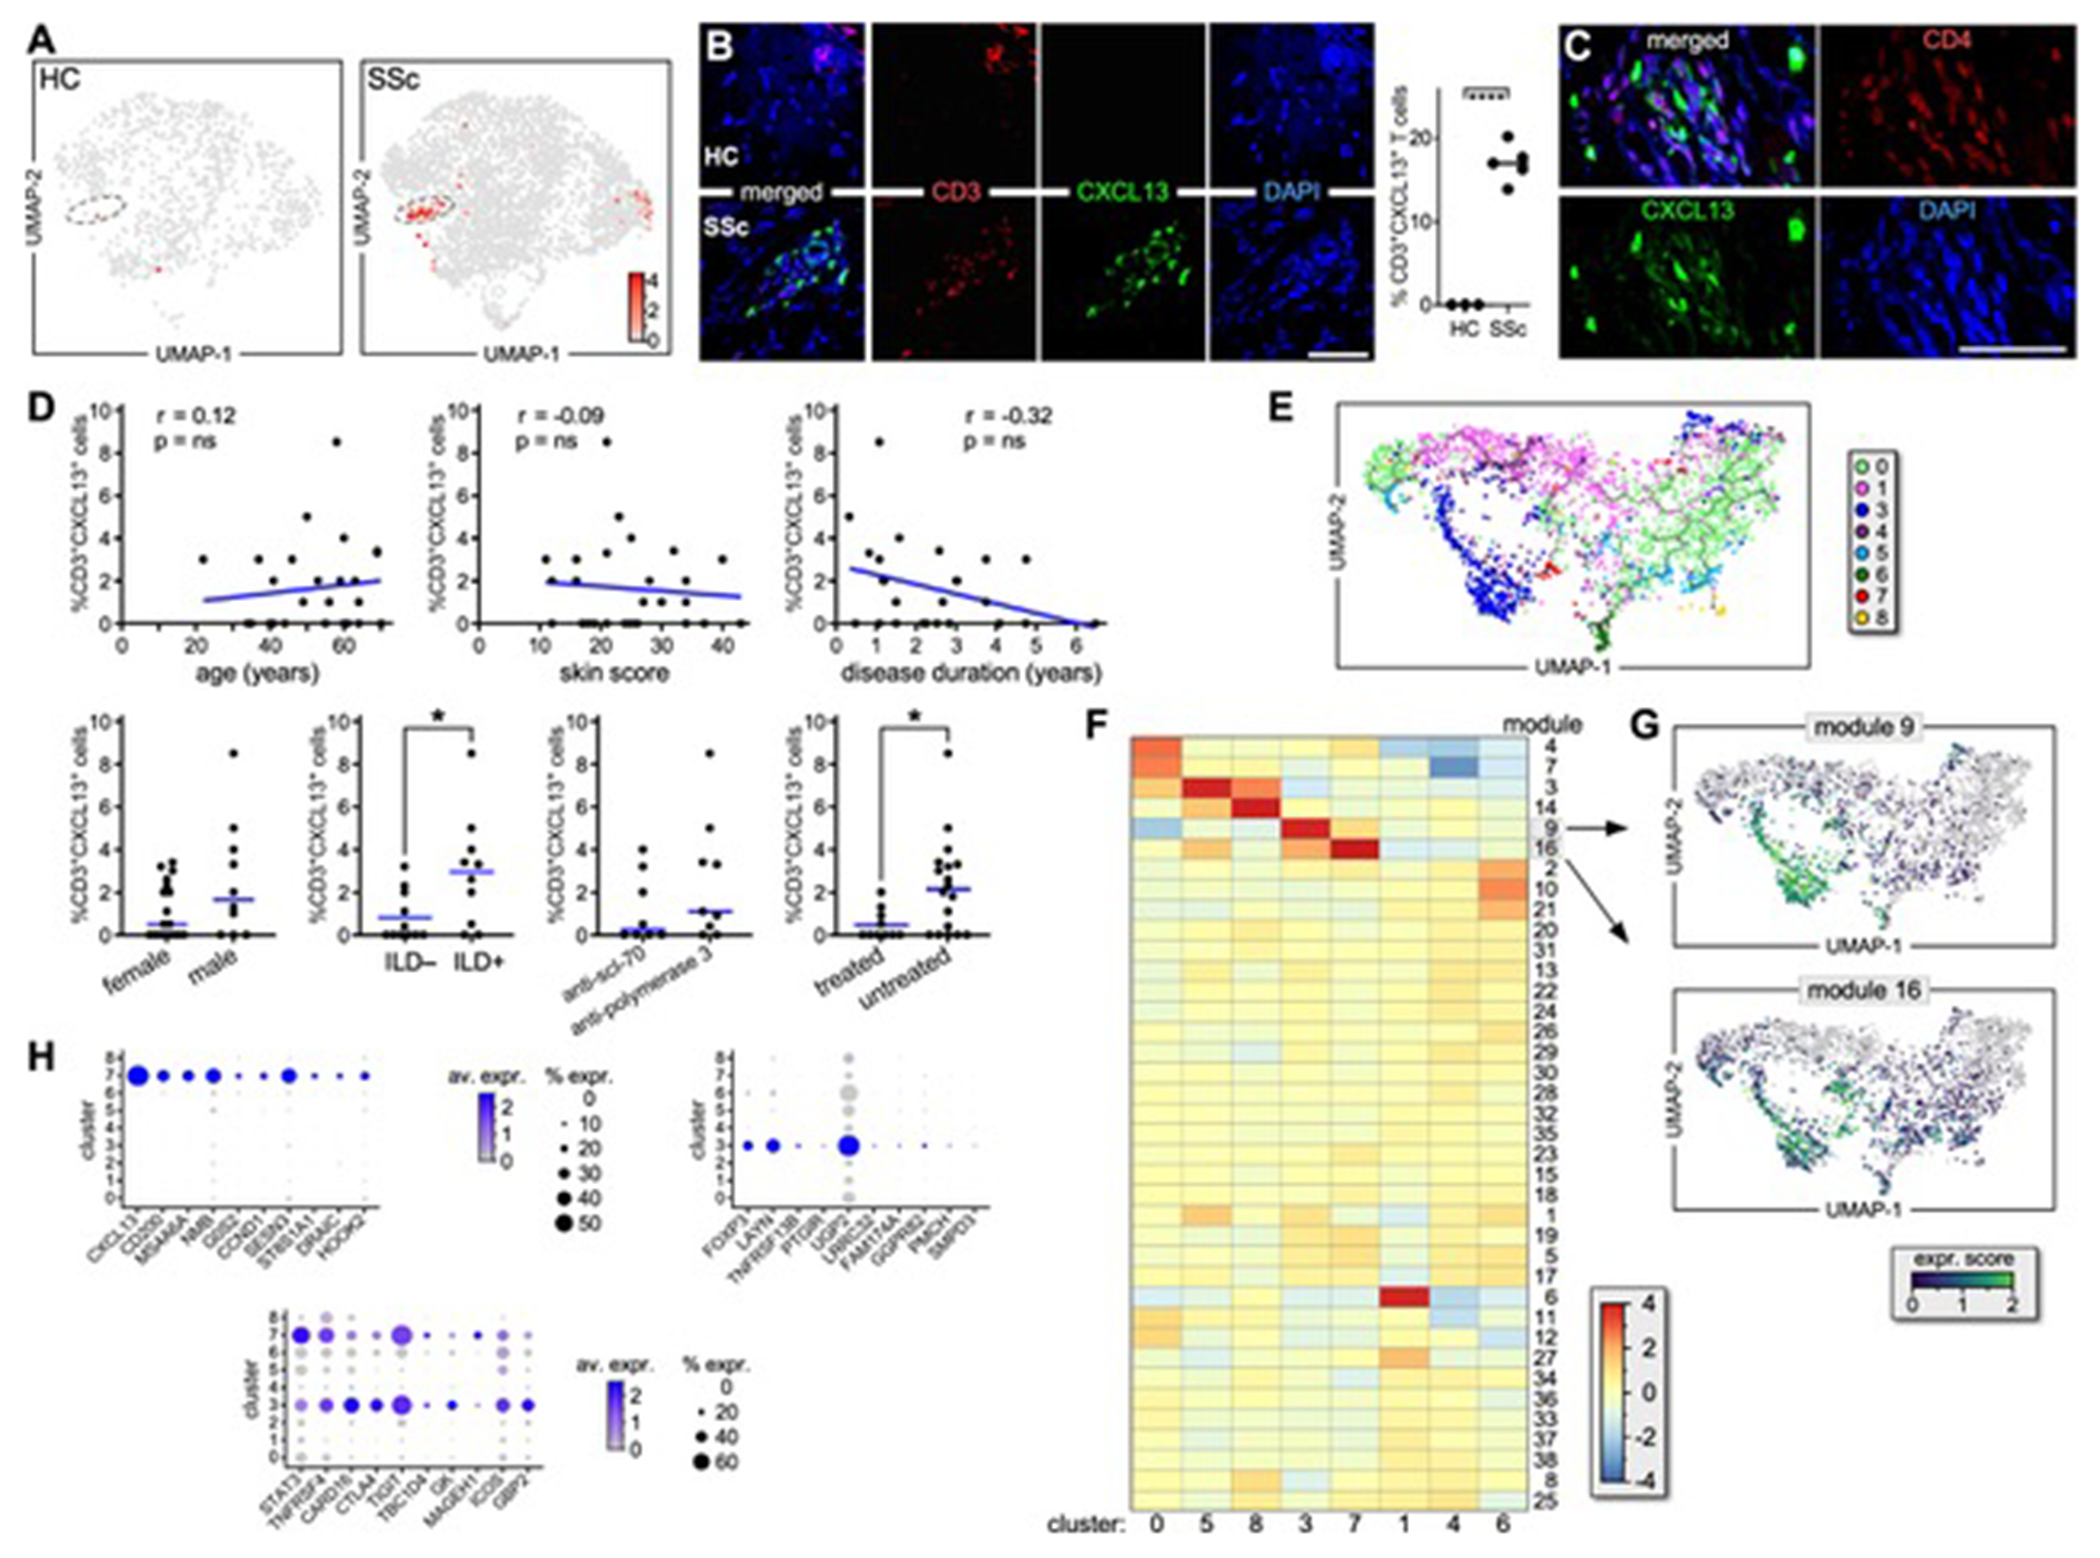
(A) CXCL13 expression by T lymphocytes from HC (left) and SSc (right) skin samples. (B) Immunofluorescence microscopy shows co-expression of CXCL13 and CD3 in skin samples from active dcSSc (n=5) and HC (n=3). A representative example and the proportion of CD3+CXCL13+ cells are shown. Results are expressed as a percentage of positive cells out of the entire infiltrate following quantification of 8 high-power fields/sample (HPF; magnification X600). Error bars are mean ± SD. Statistics by t-Student’s test. (C) Immunofluorescence microscopy shows co-expression of CXCL13 and CD4 in dcSSc skin samples (n=5). A representative experiment is shown at 1000X. (D) Correlation between the frequency of CD3+CXCL13+ cells by scRNAseq and the clinical parameters of patients. (E) Single-cell trajectory of SSc and HC CD4+ T-cell clusters. (F) Heatmap shows gene expression of T-cell clusters based on Louvain-community analysis[26] (G) Expression transition of genes from modules #16 and 9 along the pseudotime. (H) Dot plots show the proportion of cells and the scaled average gene expression of genes uniquely expressed by CD3+CXCL13+ cells or Tregs or commonly expressed.