
Figure 4. SSc CD3+CXCL13+ T cells are a TFH-like subset in inflamed SSc skin.
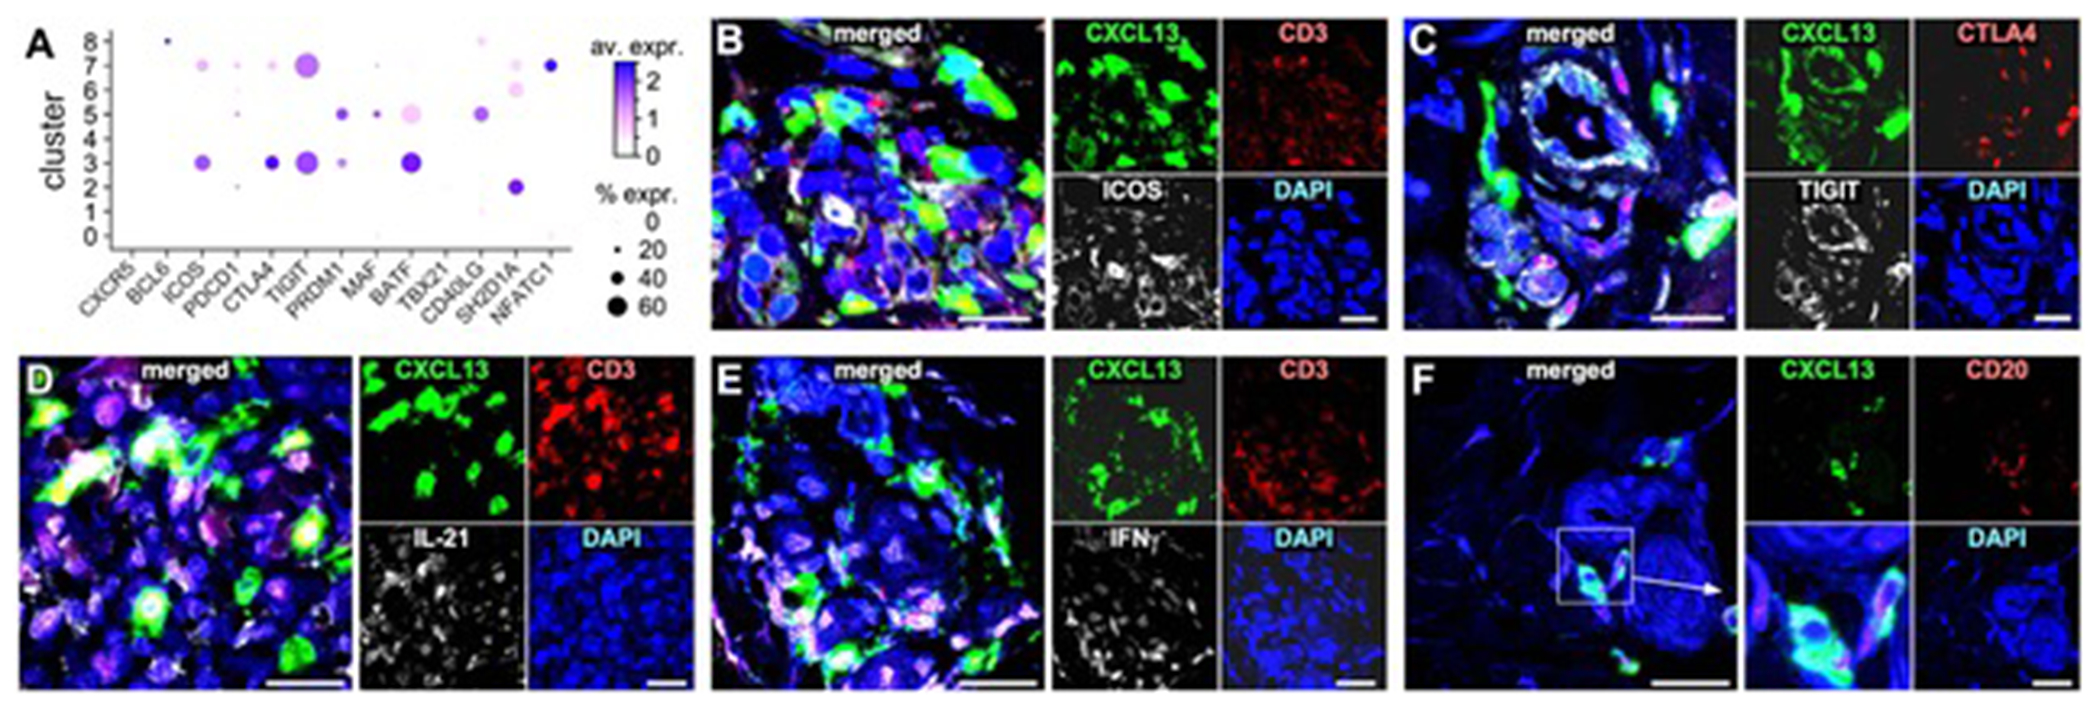
(A) Dot-plot showing the proportion of cells and the scaled average gene expression of selected TFH genes [27] by T-cell clusters identified in Figure 1C. Multicolor immunofluorescence microscopy visualizes co-expression of CXCL13, CD3, ICOS (B), CXCL13, TIGIT, CTLA4 (C), CXCL13, CD3, IL-21 (D), CXCL13, CD3, IFNγ (E), and CXCL13, CD3, CD20 (F) in active dcSSc skin samples (n=5). Representative examples are shown at 1000X, inset in (F) is zoomed-in by 3X. DAPI stains nuclei.