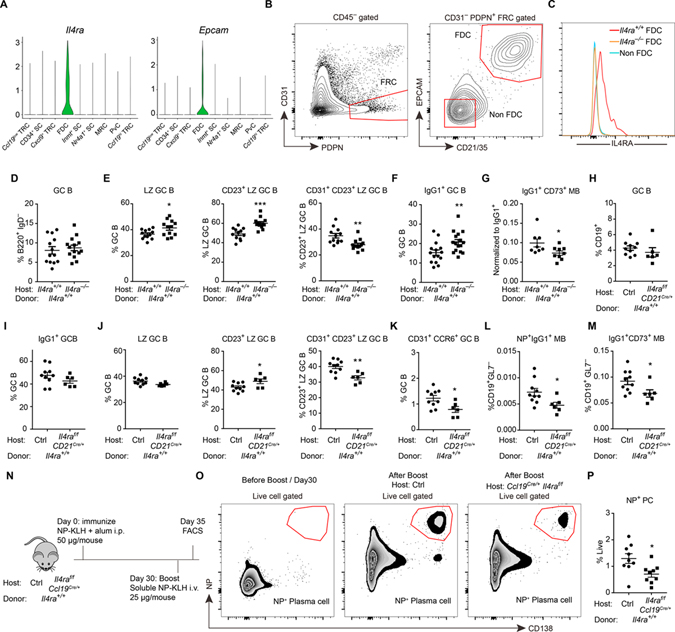
Figure 6. IL4RA expression by FDCs limits IL4 availability to GC B cells.
(A) Violin plots of Il4ra and Epcam expression in different stromal cell subsets. (B, C) Representative FACS profiles (B) and histograms (C) of IL4RA in non-FDCs (CD45− PDPN+ CD31− CD21/35− EPCAM−) and FDCs (CD45− PDPN+ CD31− CD21/35+ EPCAM+) isolated from mesenteric LNs in mice with indicated genotype. Data represent two experiments, with at least three mice per experiment. (D-G) Reverse chimaeras were made by reconstituting irradiated Il4ra+/+ and Il4ra−/− mice with WT BM. (D-F) Frequencies of CD95hi GL7hi GC B cells in B220+ IgD− B cells (D), CXCR4lo CD86hi LZ cells in GC B cells (E left), CD23+ cells in LZ B cells (E middle), CD31+ cells in CD23+ LZ B cells (E right) and IgG1+ cells in GC B cells (F) 13 days after immunization. (G) Ratio of CD73+ IgG1+ memory B cells to IgG1+ cells. Data are pooled from three experiments. (H-M) Reverse chimeras were made by reconstituting irradiated control and Cd21Cre/+ Il4raf/f mice with wild-type (Il4ra+/+) BM. (H-K) Frequencies of CD95hi GL7hi GC B cells in CD19+ B cells (H), IgG1+ cells in GC B cells (I), LZ cells in GC B cells (J left), CD23+ cells in LZ B cells (J middle), CD31+ cells in CD23+ LZ B cells (J right) and CD31+ CCR6+ cells in GC B cells (K) 13 days after immunization. (L, M) Frequencies of NP+IgG1+ (L) and CD73+ IgG1+ (M) memory cells in non-GC B cells. (N-P) Scheme for testing memory response in Ccl19Cre/+ Il4raf/f mice that had been reconstituted with wild-type BM (N), flow cytometry plots from the indicated mice (O), and summary data (P) showing frequency of CD138+NP+ plasma cells in the spleen of boosted control or Ccl19Cre/+ Il4raf/f chimeric mice. Data are pooled from two of three experiments. In D-M and P, each symbol represents one mouse. See also Figure S6.

