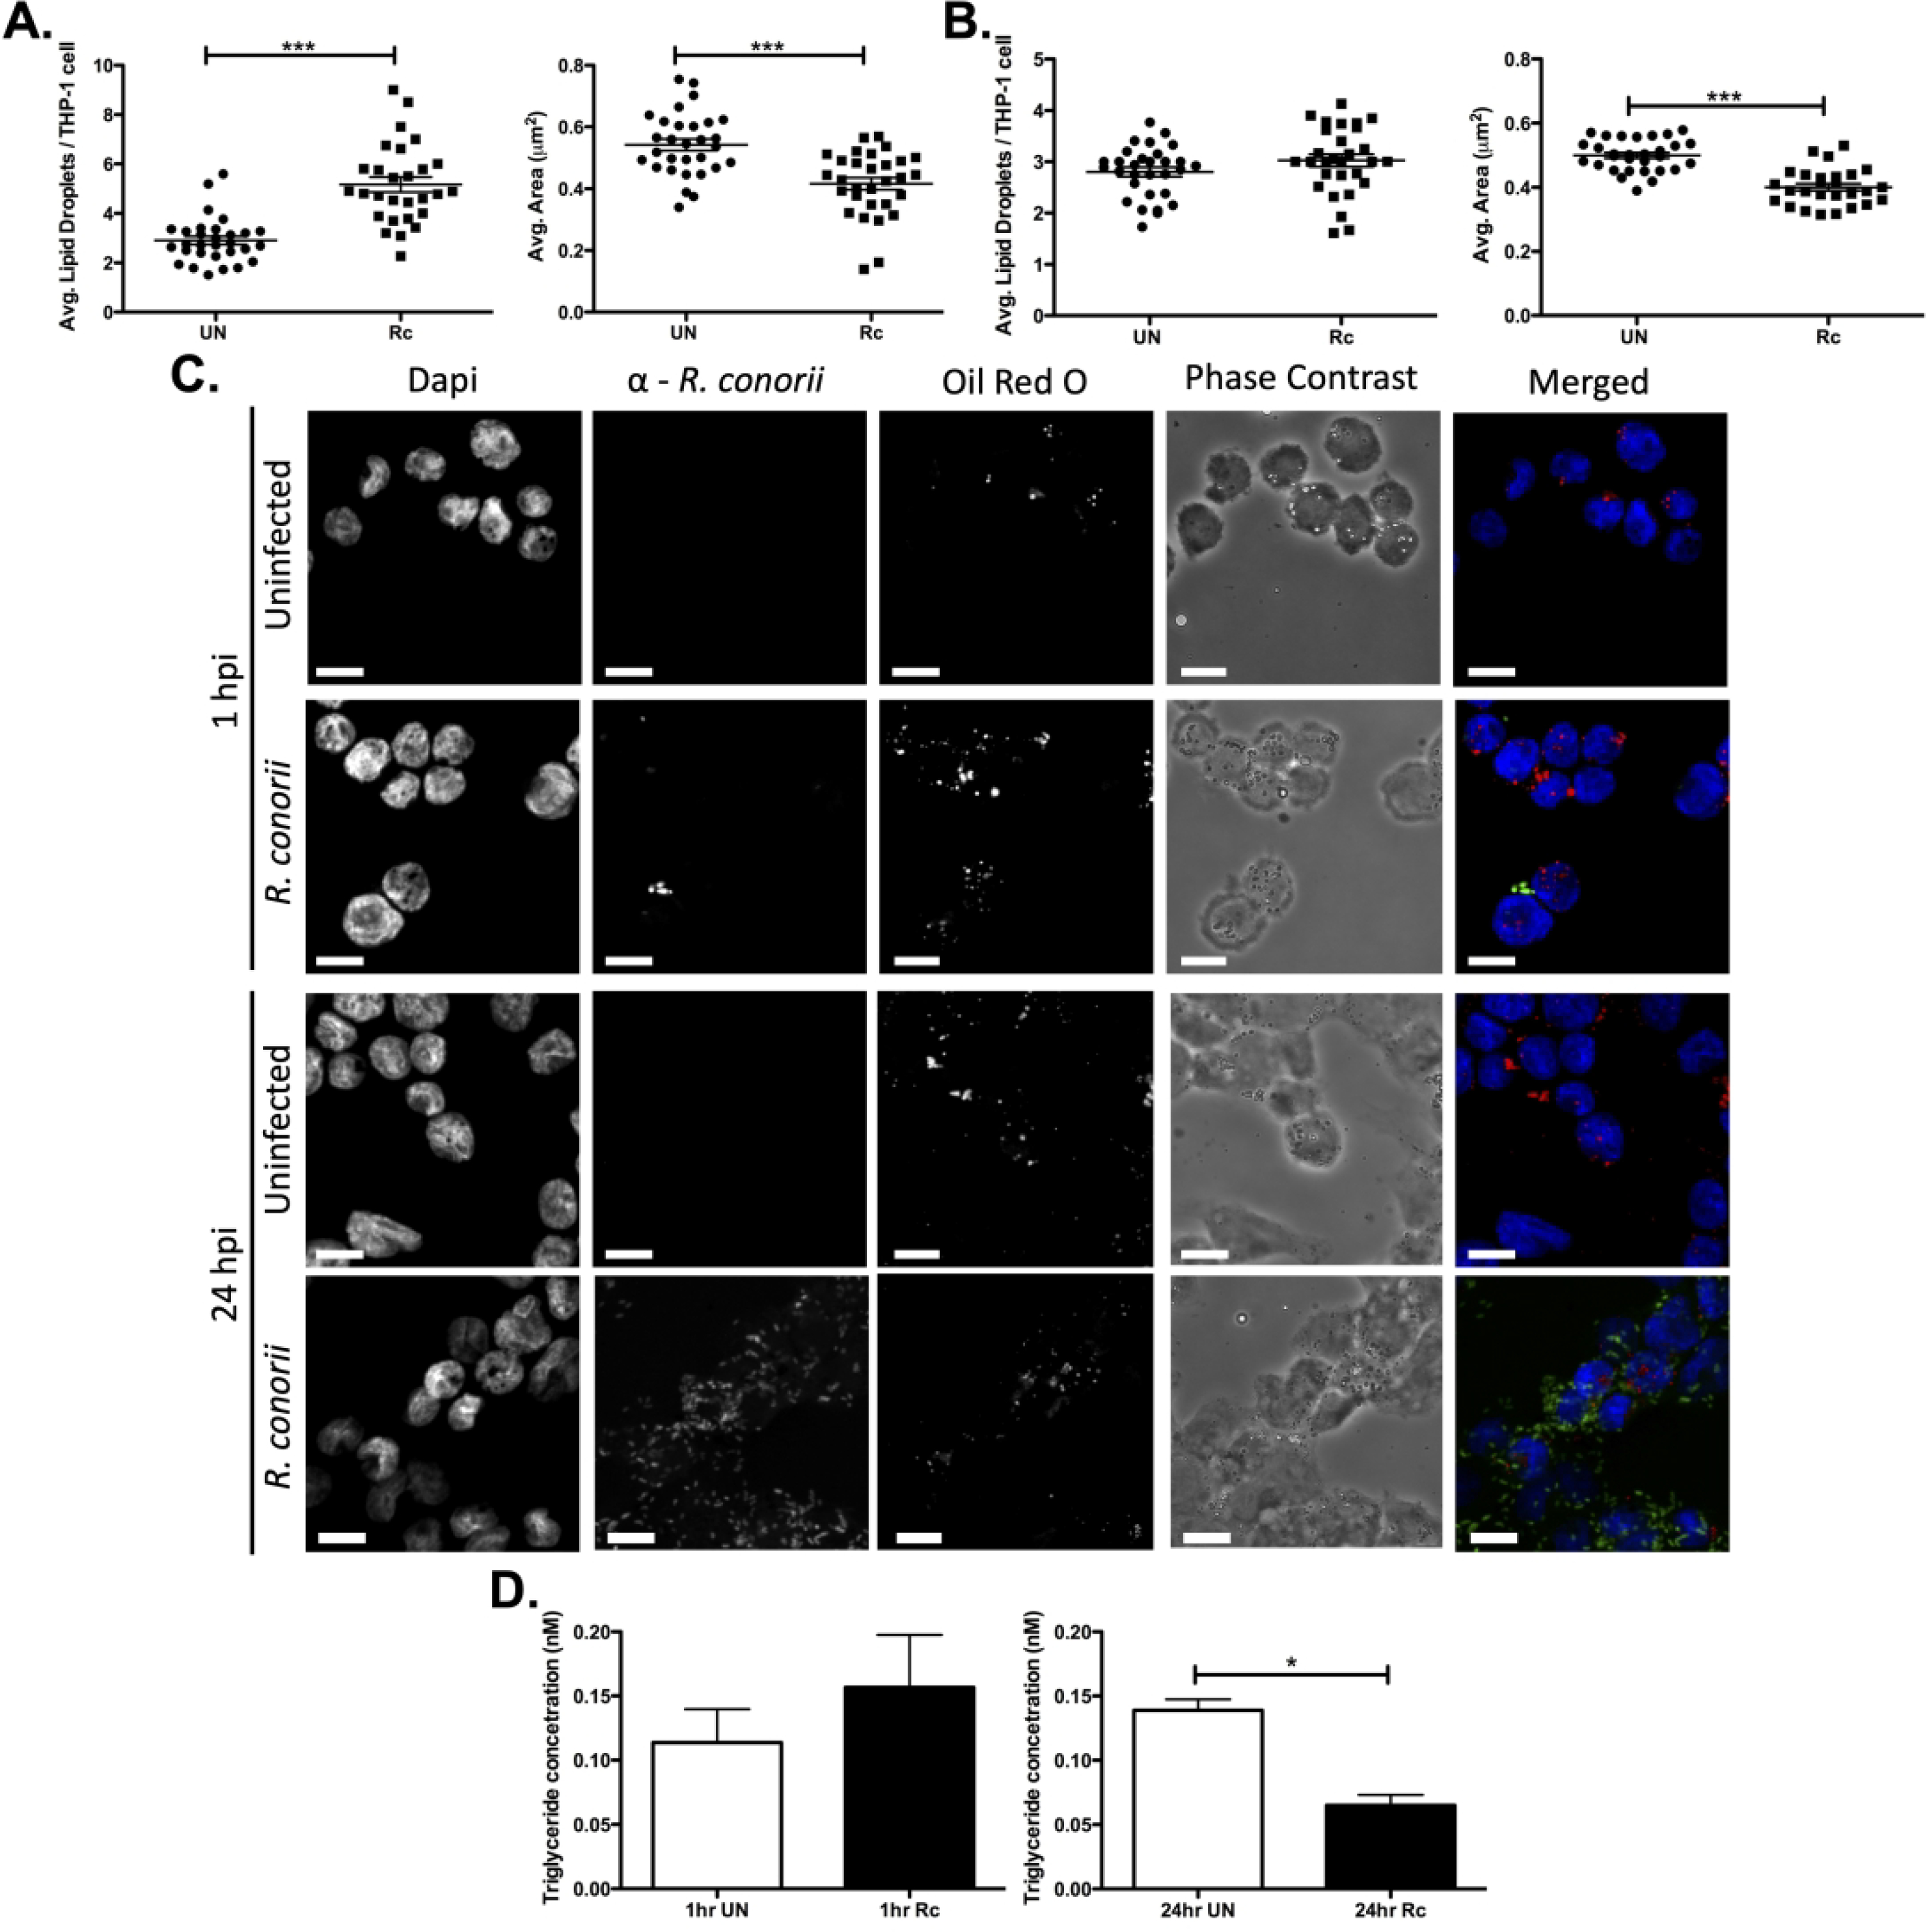
Figure 1.

Modulation of host lipid droplets (LDs) during R. conorii THP-1 macrophage infection. THP-1 macrophages were infected with R. conorii at a multiplicity of infection of 2. Oil Red O was used for quantification of average LDs per THP-1 cell and average area (μm2) at 1 hour post infection (hpi; A) and 24 hpi (B). Ten fields of view from three independent experiements with 3–15 cells per field of view were quantified for both uninfected (UN) and R. conorii (Rc)-infected samples using ImageJ software with a constant threshold for all images. (C) A single representative image of fields taken at 100X with oil red O (red) signifying LDs, α-Rickettsia (green) signifying R. conorii, and DAPI (blue) signifying nuclei. White bar is indicative of 10μm. (D) Triglyceride quantification was performed for three independent experiments with three experimental replicates of unifected and R. conorii infected samples at 1 hpi and 24 hpi. Significance is represented by p≤0.05 determined by a one-way Student t-test for each time-point separately. Statistical significance is defined by *p≤0.05, **p≤0.005, or ***p≤0.001.
