Figure 6.

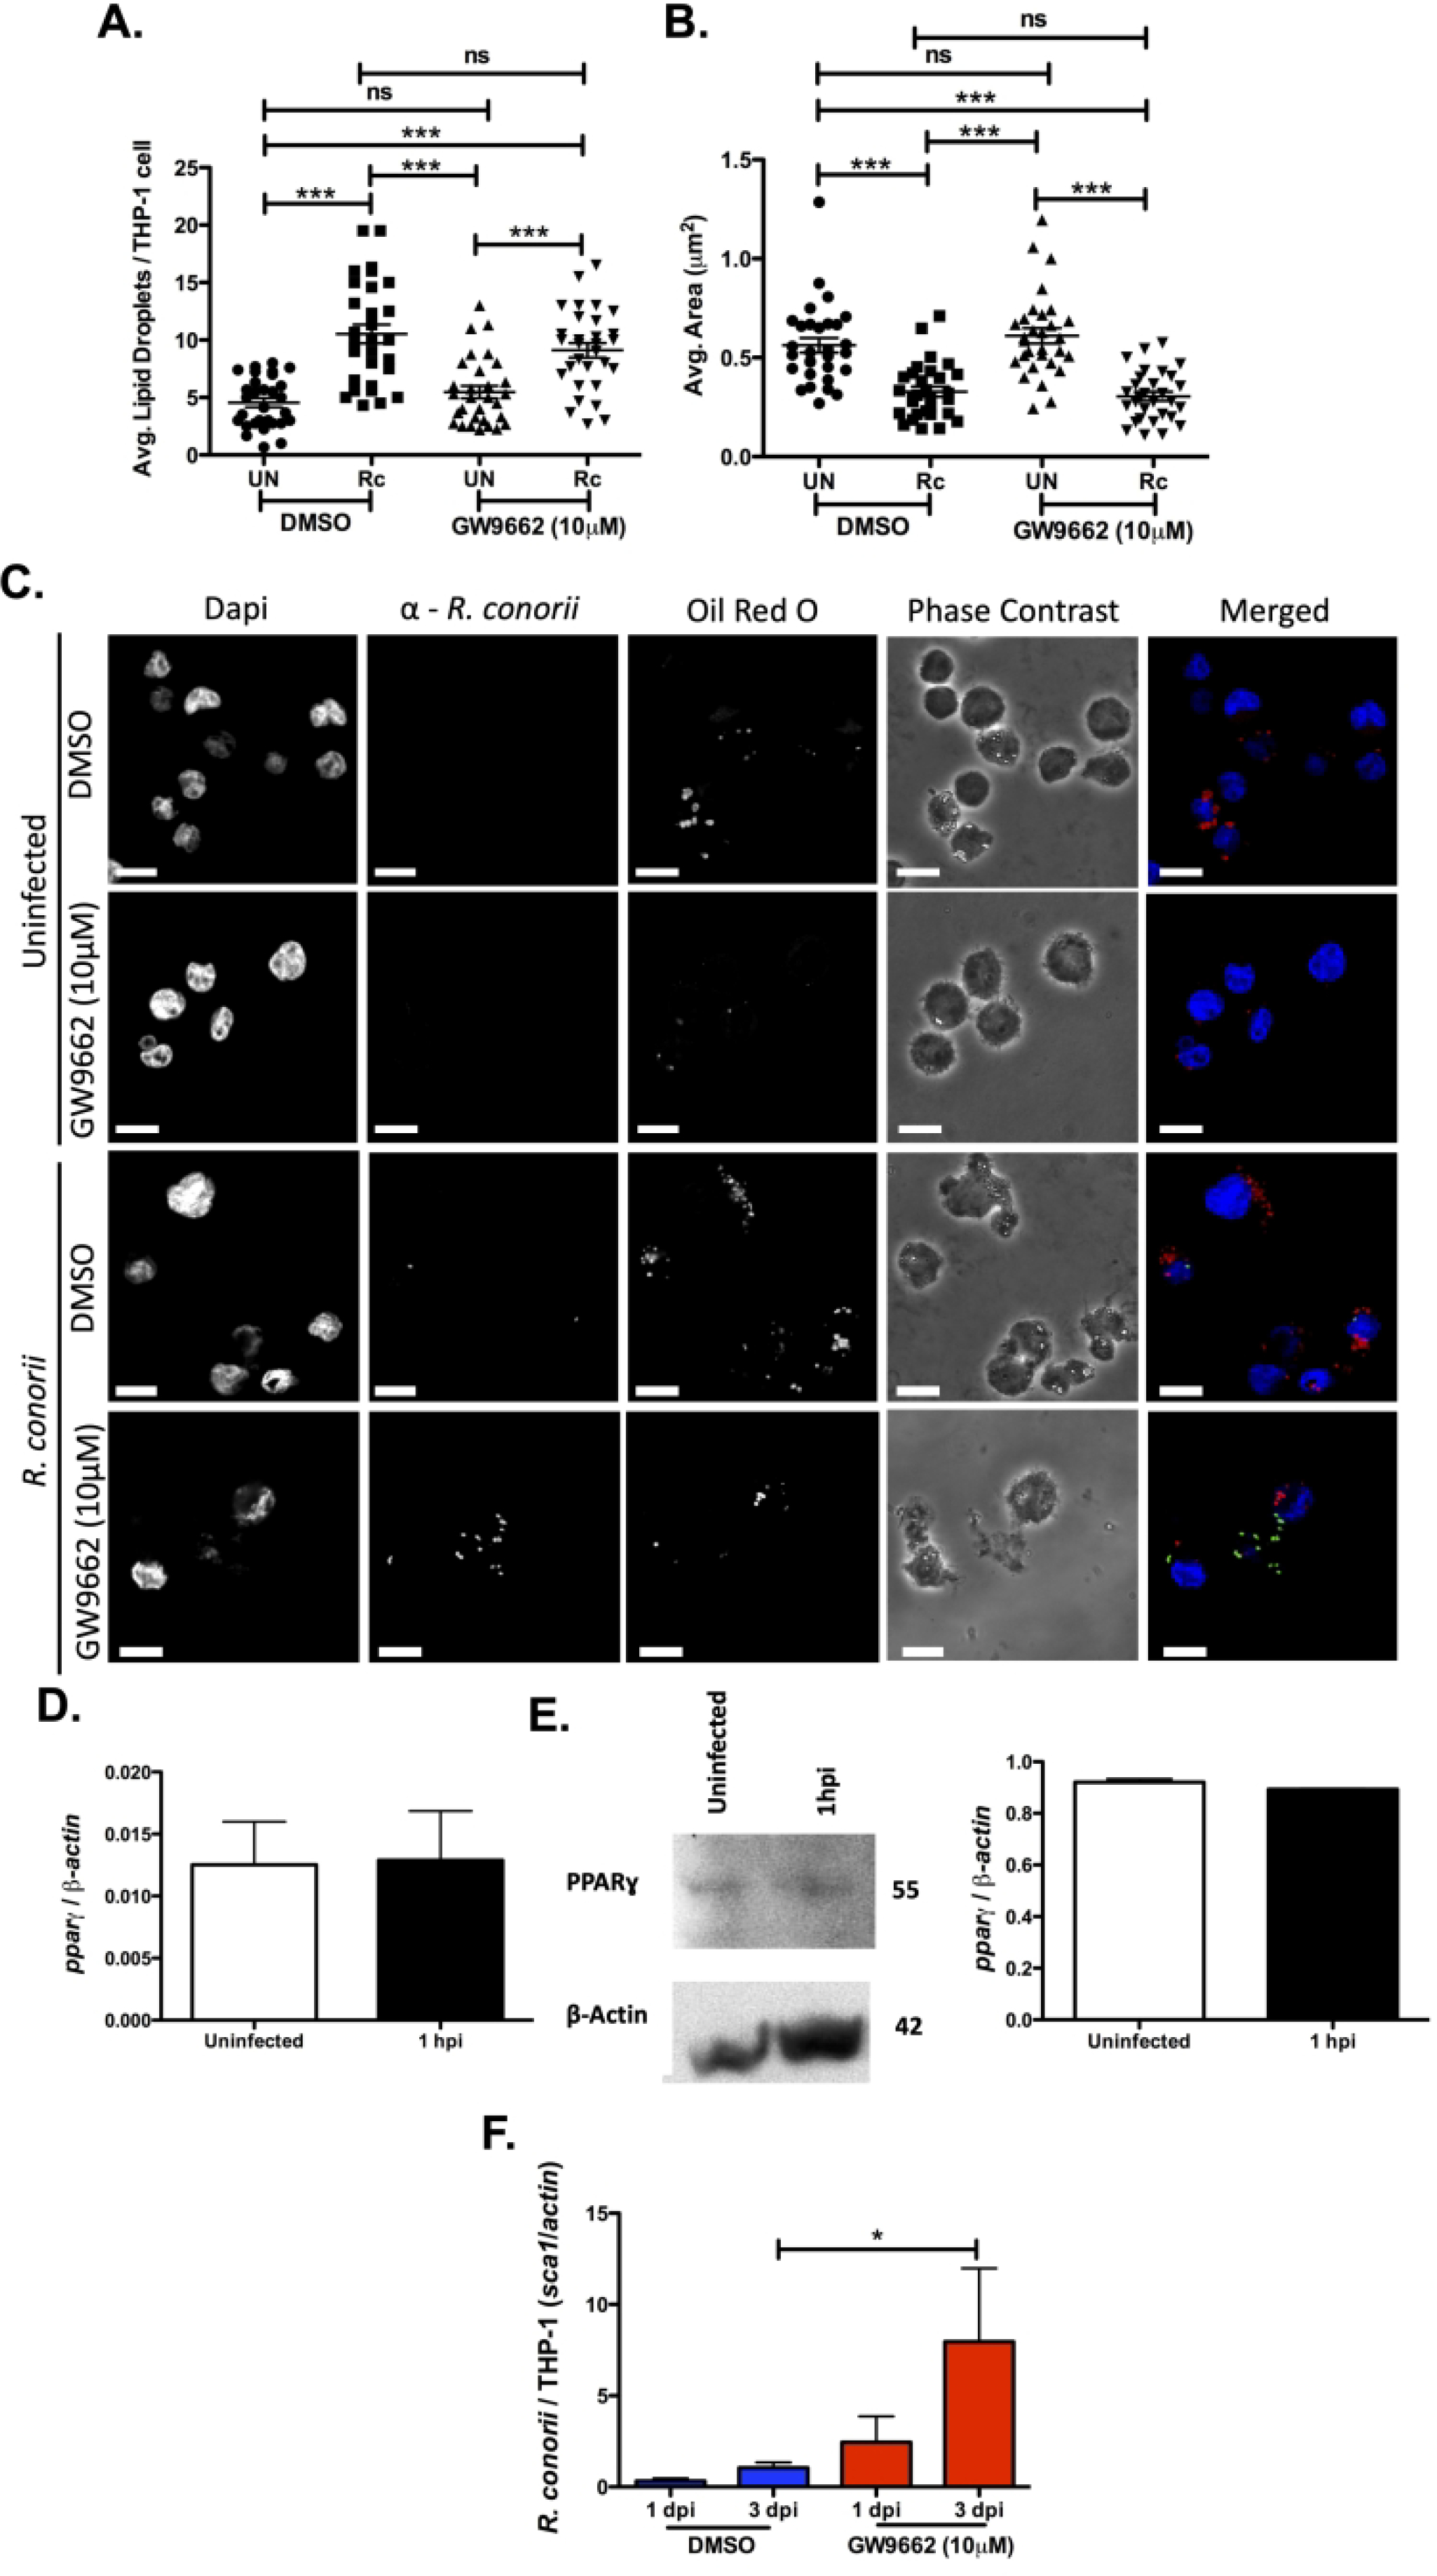
Inhibition of PPARɣ is positively correlated with increased R. conorii infection of macrophages. Samples for LD analysis were collected at 1 hour post infection (hpi) before being stained with Oil Red O for visualization of LDs. Ten fields of view from three independent experiements with 3–15 cells per field were quantified to define (A) average lipid droplets (LDs) per THP-1 cell and (B) average area (μm2) for all groups using ImageJ software with a constant threshold. (C) A representative visualization of one cell at 100X within each treatment group. Oil red O (red) signifies LDs, α-Rickettsia (green) signifies R. conorii, and DAPI (blue) signifies nuclei. White bar is indicative of 10μm. (D) qRT-PCR analysis with total RNA from R. conorii infected (MOI of 2) THP-1 macrophages to determine mRNA expression of pparɣ at 1 hour post infection (hpi). (E) Immunoblotting with whole cell lysates for protein expression of PPARɣ at 1 hpi in uninfected or R. conorii infected (MOI of 2) THP-1 macrophages. (F) qPCR analysis with gDNA from pre-treated THP-1 macrophages infected with R. conorii (MOI of 2) in the presence of DMSO and GW9662 for inhibition of PPARɣ at 1 days post infection (dpi) and 3 dpi. All data is representative of three independent experiments with each condition performed in triplicate. Significance is represented by p≤0.05 determined by a one-way ANOVA followed by Bonferroni’s correction post hoc test. Statistical significance is defined by *p≤0.05, **p≤0.005, *** p≤0.001.
