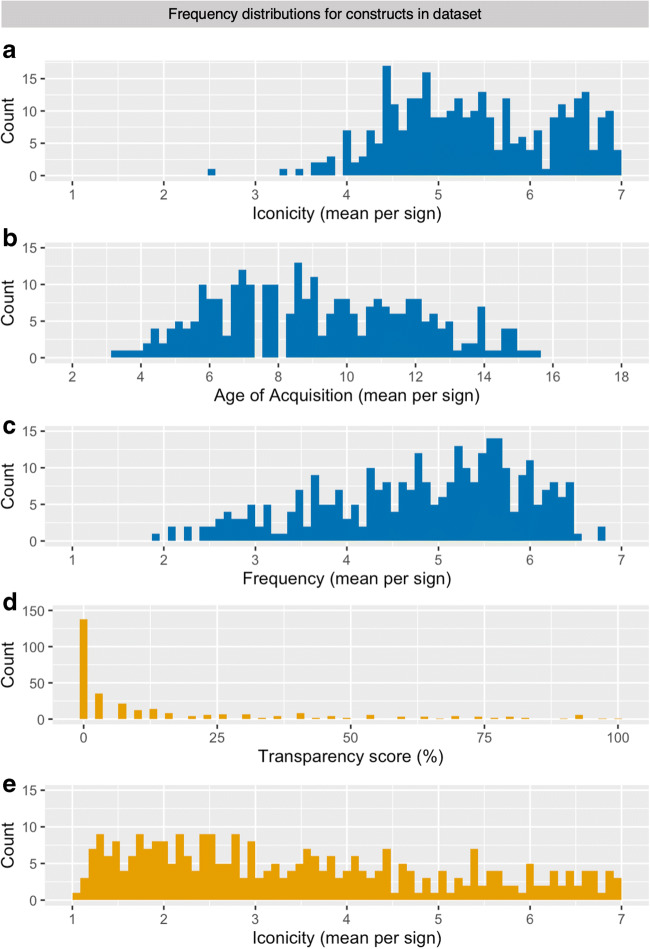
Fig. 2.
Frequency histograms showing the distribution of ratings for the 310 DGS signs normed in the present study. Results from the group of deaf signers are color-coded in blue, those from hearing non-signers are presented in orange. a Distribution of iconicity ratings obtained from deaf signers. b Distribution of age of acquisition ratings obtained from deaf signers. c Distribution of frequency ratings by deaf signers. d Distribution of transparency scores for each sign computed from guesses of a sign’s meaning by hearing non-signers. e Distribution of iconicity ratings obtained from hearing non-signers

