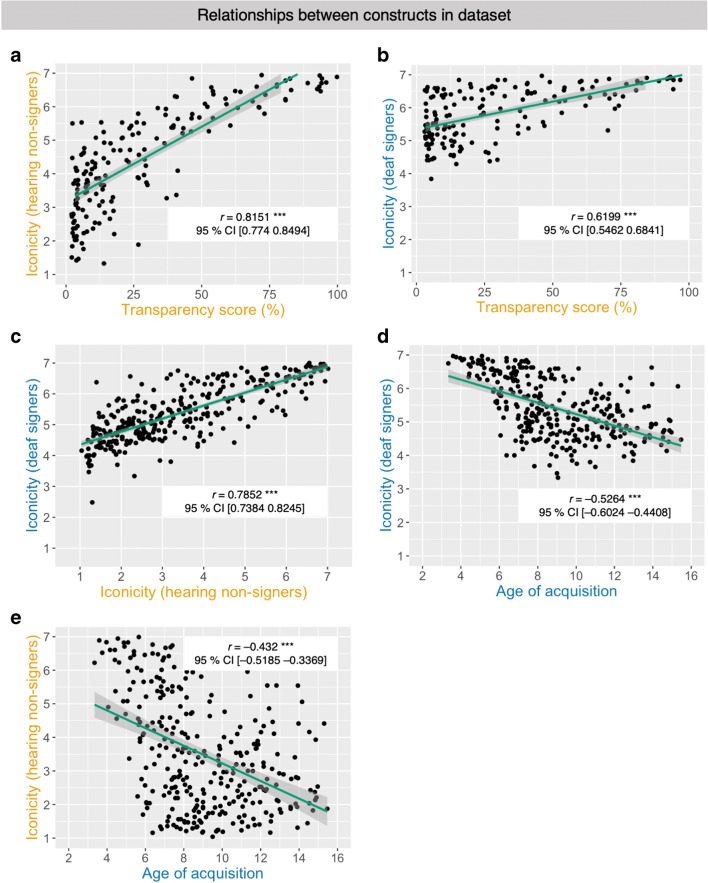
Fig. 3.
Scatterplots and regression lines (with 95% confidence intervals) depicting the correlations between different variables in the dataset. a Transparency scores by hearing non-signers and iconicity ratings by hearing non-signers, b transparency scores by hearing non-signers and iconicity ratings by deaf signers, c iconicity ratings by both groups of participants, d iconicity ratings by deaf signers and ratings for AoA by deaf signers, and e AoA ratings by deaf signers and iconicity ratings by hearing non-signers

