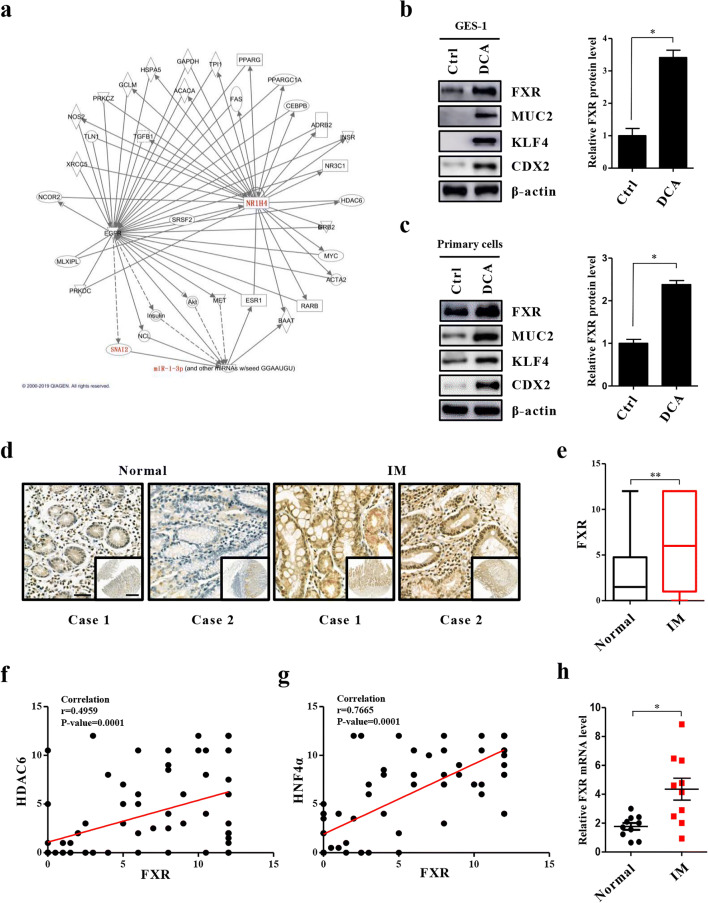
Fig. 1.
Upregulation of FXR in bile acid (BA)-stimulated intestinal metaplasia (IM) cells and tissues. (a) IPA analysis of bile acid receptors related to miR-1. (b) Left: Effects of DCA on the expression of FXR and intestinal markers (CDX2, MUC2, KLF4) in GES-1 cells. Cells were stimulated with DCA (100 μM) or vehicle alone for 24 h after which proteins were extracted and subjected to Western blot analysis. β-actin levels were used as internal control. Right: Quantification of Western blot analysis results normalized to β-actin. (c) Left: DCA (100 μM) enhances FXR protein levels and intestinal markers in primary gastric epithelial cells. Right: Quantification of Western blot analysis results normalized as in 1b. (d, e) Immunohistochemical (IHC) staining for FXR in normal (n = 24) and IM (n = 80) tissues on microarrays. Scale bars: 100 μm and 500 μm (insets). (f, g) Correlation between FXR and HDAC6 or HNF4α expression in IM tissues detected by IHC. X-axis: FXR expression level. Y-axis: HDAC6 expression level (left) and HNF4α expression level (right). (h) FXR mRNA levels in 10 pairs of IM specimens and matched normal specimens. Each symbol represents the mean value of an individual patient. Means ± SEM of representative experiments (n = 3) performed in triplicate are shown. *p < 0.05; **p < 0.01

