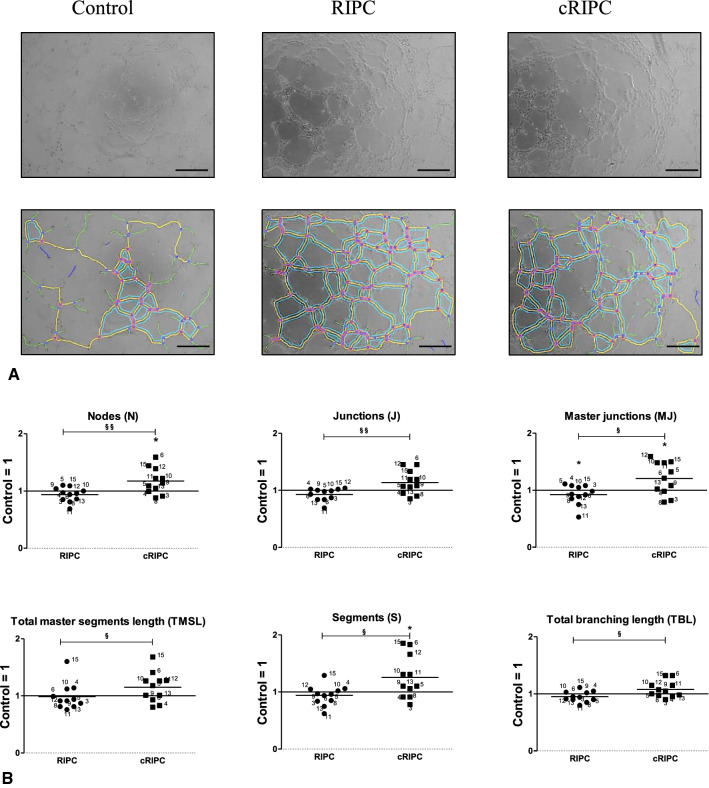
Fig. 2.
Effects of RIPC/cRIPC plasma on in-vitro angiogenesis. A representative images of HUVEC cultures that were incubated with Control, RIPC and cRIPC plasma. Upper panel, original images. Lower panel, graphical results of the analysis using the angiogenesis analyzer tool of the Image J software 1.41 (NIH) [4]. Scale bars depict 300 µm. B effects of RIPC and cRIPC plasma on key parameters of tube formation in-vitro. Control values were set to 1. Horizontal lines show the mean. *P < 0.05; one-sample T test. §P < 0.05; §§P < 0.01; two-tailed T test

