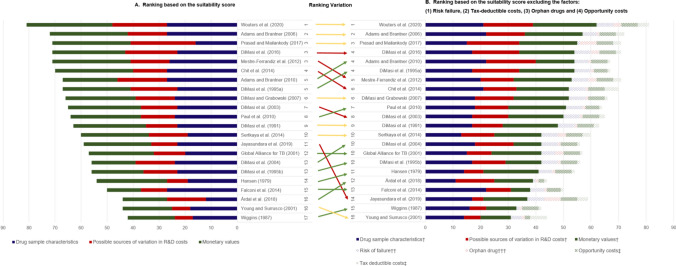
Fig. 1.
Article ranking based on the total suitability scores of the R&D cost estimation. † Excluding the factor(s) that is (are) plotted separately. †† Part of the “Drug sample characteristic group”. ††† Part of the “Possible sources of variation in R&D costs group”. ‡ Part of the “Monetary values group”. The number next to the reference represents the ranking of the estimation in accordance with the value of the suitability score. Estimations that share the same suitability score have the same ranking. Source: Authors’ elaboration

