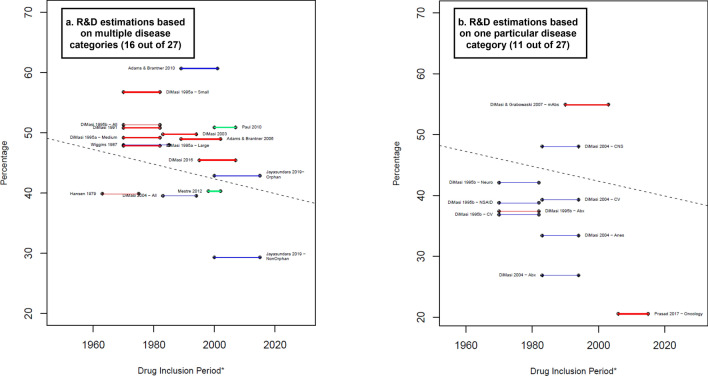
Fig. 4.
Costs of time as proportion of the average capitalized R&D costs. Blue lines: R&D costs estimation for the clinical phases. Red lines: R&D costs estimations that include an approximation for the discovery and preclinical phases. Green lines: R&D costs estimations that include an approximation for the discovery and preclinical phases as well as the R&D during the period of submission of market approval. Percentage that the costs related to time represents equal to: . * A thicker line represents a higher value in the suitability score, thus higher suitability of the R&D cost estimation. The length of the lines corresponds to the drug inclusion period. Dashed line: OLS regression (excluding Jayasundara et al. [40], Chit et al. [45], and Wouters et al. [19] for Oncology): . Year corresponds to the middle point of the drug inclusion period, additional details in electronic supplementary information 6. Abx anti-infectives, All the estimation includes all the observations in the sample, Anes analgesics/anesthetic, CNS central nervous system, CV cardiovascular, At&Me metabolism and endocrinology, Large large enterprises, mAbs monoclonal antibodies, Max maximum reported value, Medium medium enterprises, Min minimum reported value, Neuro neuropharmacological, NSAID nonsteroidal anti-inflammatory drugs, Small small enterprises, TB tuberculosis. Note: (1) Each line corresponds to one main R&D estimate. When more than one R&D costs estimate is reported, we refer to each by including the reference of the corresponding article and a keyword that describes the main characteristic of the R&D costs estimate. Wouters et al. [19] categorized each selected data point as high, medium, or low quality, depending on the availability and consistency of reported data. "High-quality" corresponds to the estimation considered only high-quality observations. (2) The drug inclusion period corresponds to the time period considered by the authors for the selection of the drug sample. In most articles, it is the period in which the drug was first tested in humans. Nevertheless, some authors applied different definitions. For more details, see electronic supplementary information 2. (3) DiMasi and Grabowski [53] also considered therapeutic recombinant proteins. (3) Chit et al. [45] was excluded from this figure because their capitalized cost estimation was reported in 2022 Canadian dollars, for which we do not have a proper method to deflate to 2019 values. Source: Authors’ elaboration.

