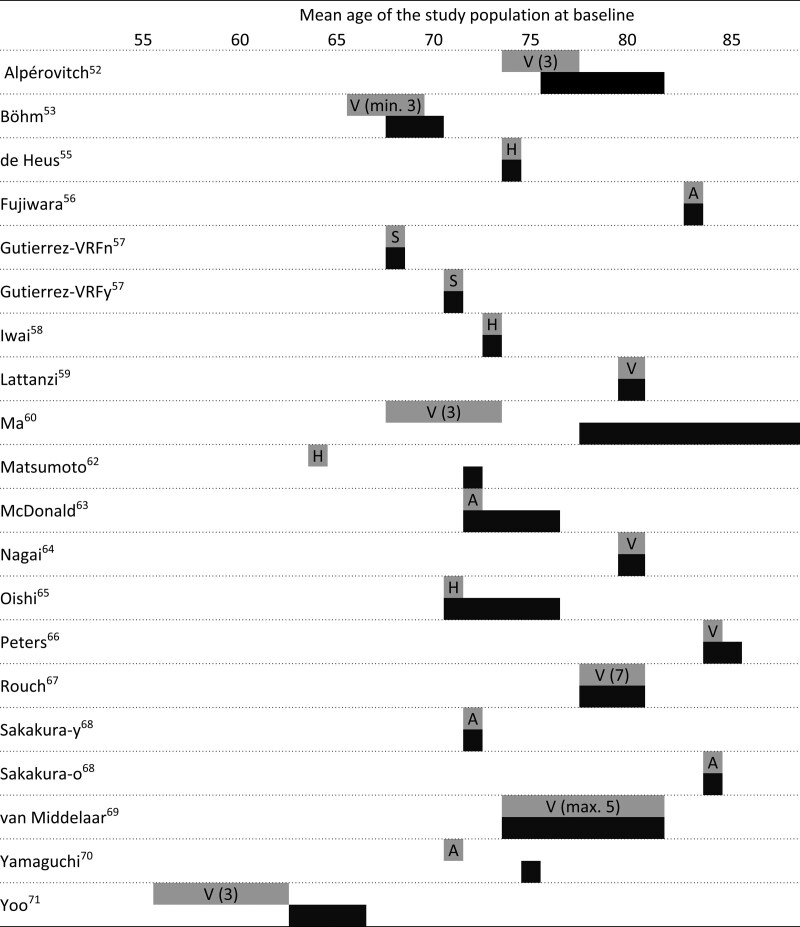
Figure 2.
Schematic overview of included studies for the primary analysis. X axis represents time in years and each study is presented at the mean age of the study population at baseline. Chuang et al54 (2016) and Matsumoto et al62 (2018) are missing from this overview because these studies (abstract only) did not report the mean age of the study population. A indicates ambulatory blood pressure measurements (24-h); H, home blood pressure measurements; S, single-visit (within-visit BP variability); and V, visit-to-visit variability (number presents number of visits.

