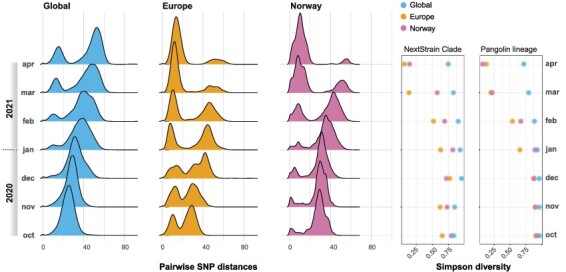
Figure 2.

SARS-CoV-2 diversity over time across geographic scales. The ridgeline plots illustrate the evolution of pairwise SNP distances over time (October 2020–April 2021) across subsets of genomes sampled globally in Europe or in Norway only. The dot plots on the right illustrate the corresponding Simpson diversity estimates at the level of NextStrain clades and Pangolin lineages.
