Figure 4.

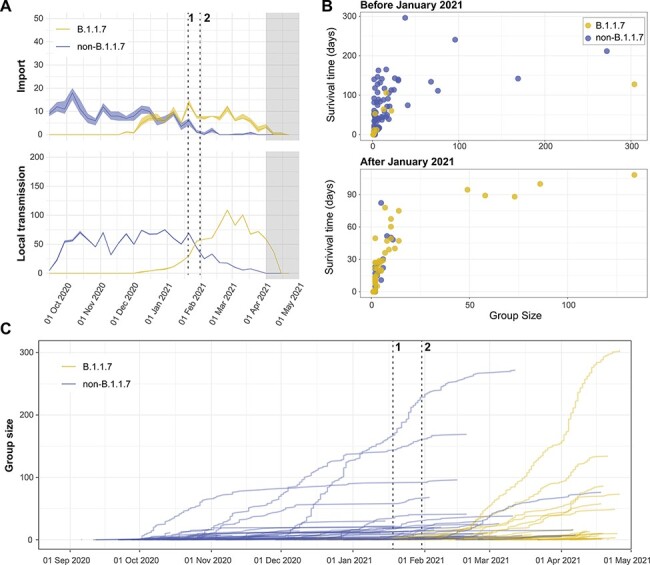
Genome epidemiology of B.1.1.7 and non-B.1.1.7 in Norway. (A) Weekly estimated imports (top panel) and local transmission events (bottom panel) of B.1.1.7 (yellow) and non-B.1.1.7 (blue) in Norway. The dashed lines mark the implementation date for key interventions: (1) mandatory testing at the border and (2) closure of the border for individuals not residing in Norway. The last 4 weeks of sampling are shaded grey as there is more uncertainty around these estimates (see main text). (B) Size and longevity of transmission clusters measured in days. ‘Survival time’ = time (days) between the estimated TMRCA and the last sampled isolate in each transmission lineage (C) Cumulative transmission lineage sizes, where each new case was added to its transmission lineage at the date of sampling. Key interventions are labelled as in (A).
