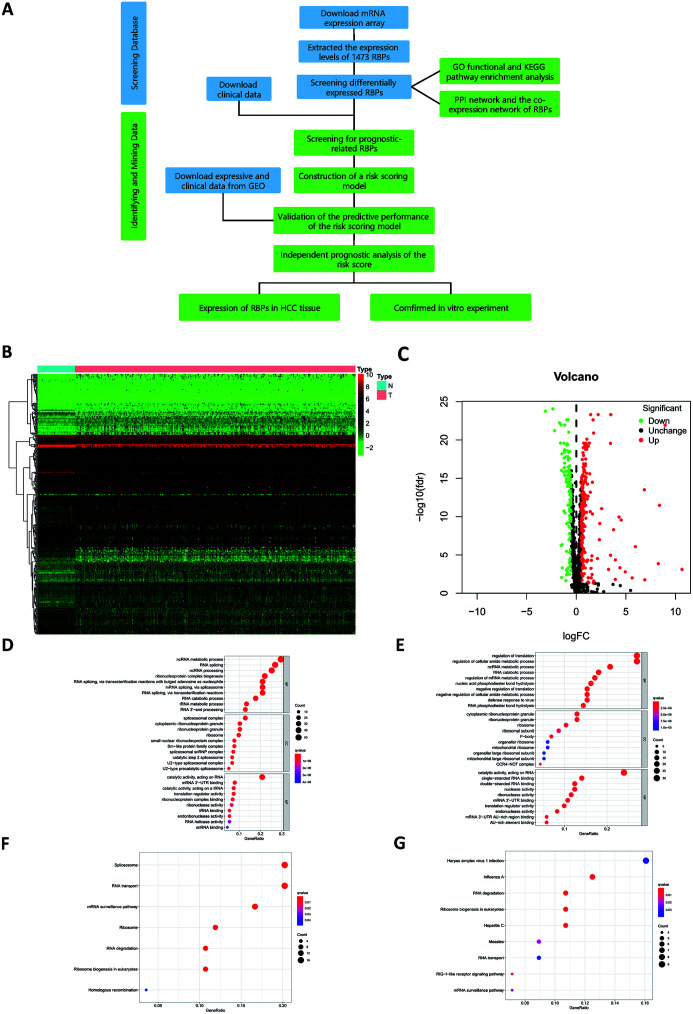
Fig. 1. Flow chart of heat map, volcano plot, GO enrichment analysis and KEGG pathway enrichment of DERs.
(A) Flow chart. (B) Heat map of DERs. (C) Volcano plot of DERs. (D) GO enrichment analysis of up-regulated RBPs. (E) GO enrichment analysis of down-regulated RBPs. (F) KEGG pathway enrichment of up-regulated RBPs. (G) KEGG pathway enrichment of down-regulated RBPs.

