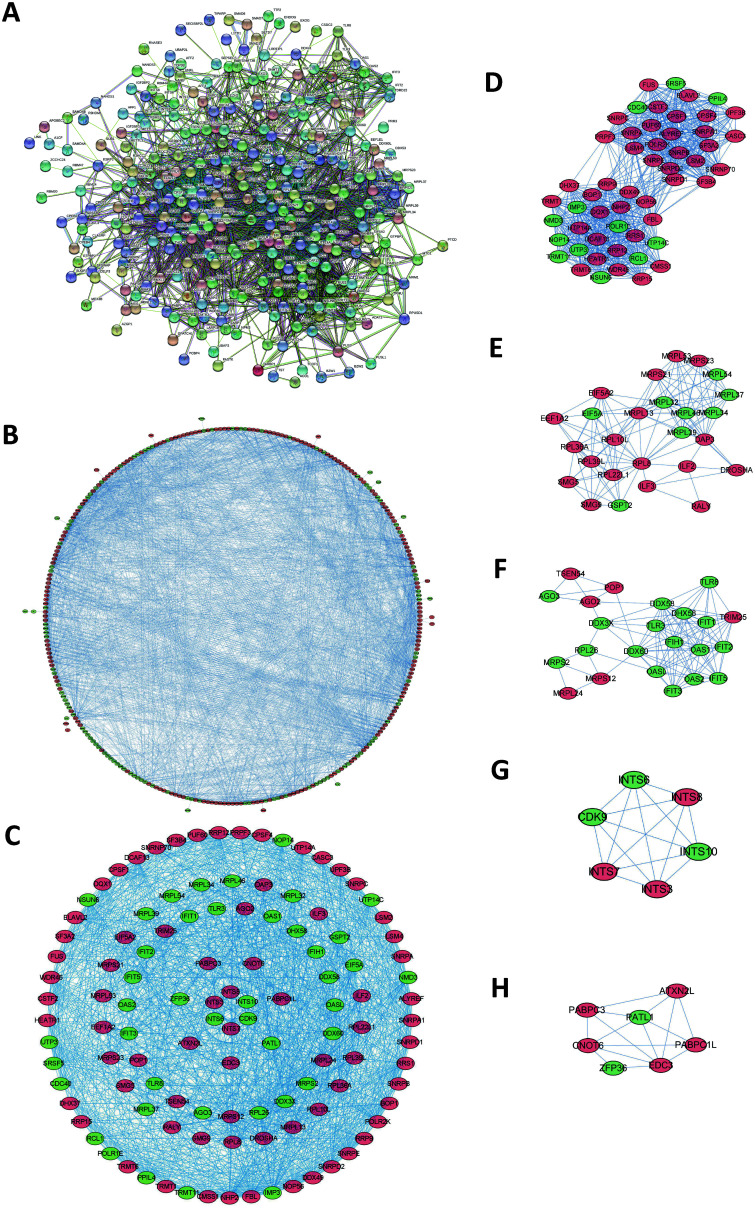
Fig. 2. Interaction network of DERs.
(A) PPI network. (B) Network visualized using Cytoscape. (C) Network of important modules. (D-H) Important subnetworks. The light blue and purple lines, respectively, indicate known interactions from curated databases and experimentally determinations. Green, red and dark blue represent predicted interactions, including gene neighborhood, gene fusions and gene co-occurrences in Fig. 2A. Red circles: up-regulated RBPs; Green circles: down-regulated RBPs in Fig. 2B-H.

