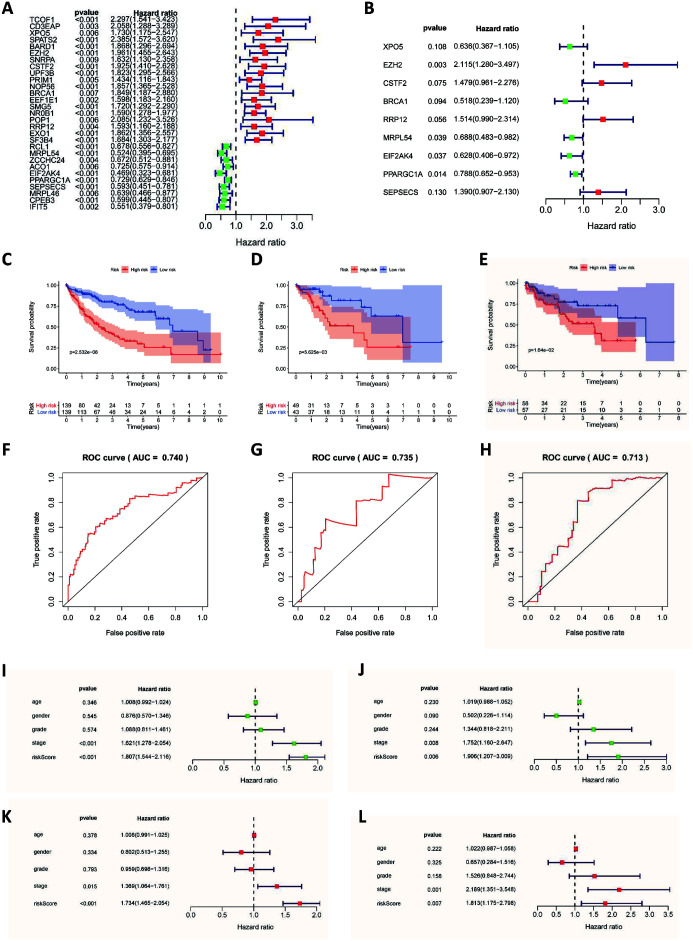
Fig. 3. Results of the Cox regression analysis, survival and ROC curves.
(A) Univariate Cox regression analysis of DERs. (B) Multivariate Cox regression of DERs. (C) Survival curve of the training group. (D) Survival curve of the test group. (E) Survival curve of the GEO group. (F) ROC curve of the training group. (G) ROC curve of the test group. (H) ROC curve of the GEO group. (I) Univariate Cox regression analysis in the training group. (J) Univariate Cox regression analysis in the test group. (K) Multivariate Cox regression analysis in the training group. (L) Multivariate Cox regression analysis in the test group. Red and blue areas: 95% confidence interval.

