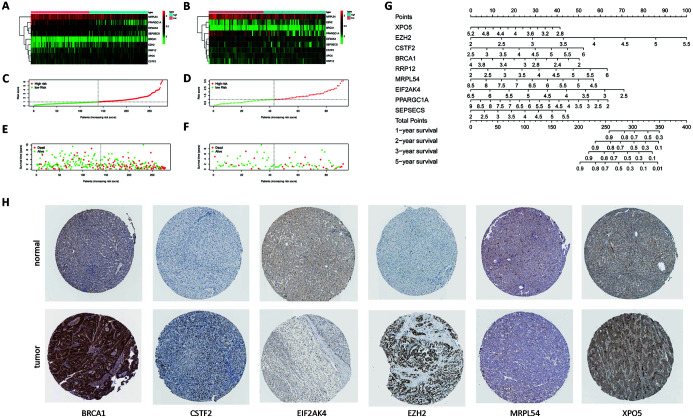
Fig. 4. Heat map and distribution of risk scores and survival status: nomogram and immunohistochemistry results.
(A) Heat map of RBPs in the training group. (B) Heat map of RBPs in the test group. (C) Distribution of risk scores in the training group. (D) Distribution of risk scores in the test group. (E) Distribution of survival status of patients in the training group. (F) Distribution of survival status of patients in the test group. (G) Nomogram for predicting 1-, 2-, 3- and 5-year overall survival of patients with HCC. (H) Immunohistochemistry results.

