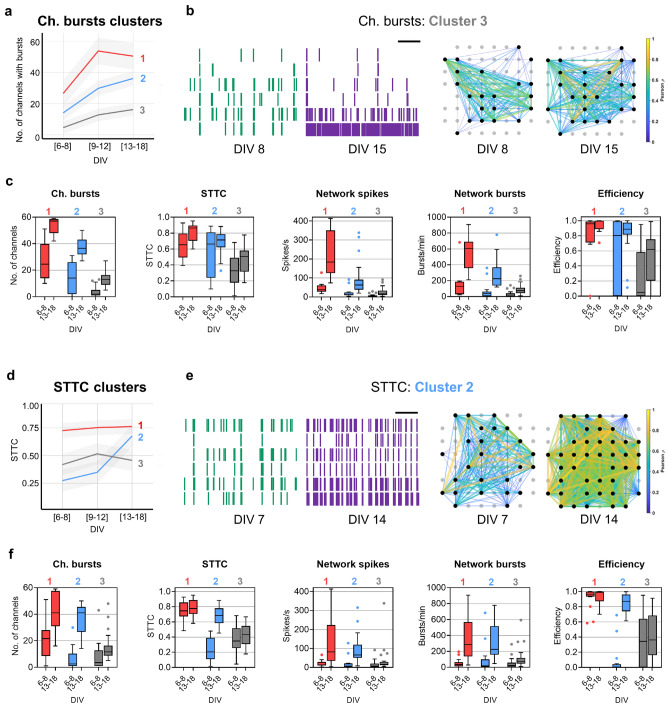
Figure 4.
Patterns of developing spontaneous activity in neuronal networks using clustering analysis. (a,d) Graphs display three developmental patterns for the features of Ch. bursts (a) and STTC identified by k-means clustering of the SOM. The lines represent the means of the observations, labelled by k-means, and the shaded areas represent the 95% confidence intervals. (b,e) Examples of raster plots (left panels) and connectivity maps (right panels) of neuronal networks included in either cluster 3 of Ch. bursts (b) or cluster 2 of STTC (e). Horizontal scale bar in raster plots, 20 s. Color of the edges between nodes in connectivity maps represents Pearson’s correlation. (c,f) Changes in Ch. bursts, STTC, Network spikes, Network bursts, and Efficiency between DIV 6–8 and 13–18 in each cluster of Ch. bursts (c) and STTC (f). The box plots show the median and the interquartile range with Tukey whiskers. Clusters are indicated on top of the graphs. The figure was created using Graphpad 8.0 (https://www.graphpad.com) (c,f), Neuroexplorer 5 (https://plexon.com/products/neuroexplorer/), Matlab 9.8 (https://www.mathworks.com/products/matlab.html) (b,e), and R 4.03 (https://www.r-project.org/) (a, d).

