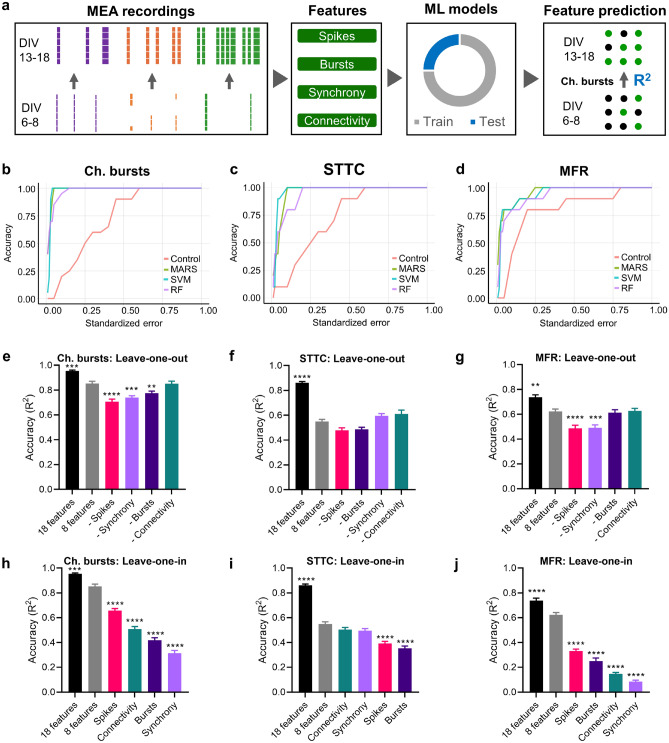
Figure 5.
Machine learning for the prediction of features of bursts, synchrony, and spikes. (a) Schematics of the machine learning workflow. The 18 electrophysiological features were analyzed from MEA recordings at DIV 6–8 and DIV 13–18 and these features were used to train (gray segment) machine learning (ML) models. Then, accuracy prediction (R2) at DIV 13–18 was evaluated in the test dataset (blue segment) for electrophysiological features (e.g., Ch. bursts). Figure created with Microsoft PowerPoint 365 (https://www.microsoft.com/powerpoint). (b–d). REC curves for control and MARS, SVM, and Random Forest (RF) machine learning models for the prediction of STTC (b), Ch. bursts (c), and MFR (d). REC curves represent the cumulative error obtained by the machine learning models. (e-j) SVM prediction of Ch. bursts (e–h), STTC (f–i), and MFR (g–j) using leave-one-out (e–g) and leave-one-in (h–j) strategies. We performed fourfold cross-validation (10 iterations) to calculate the mean accuracy of the SVM prediction using 8 electrophysiological features (2 features per group): MFR and Ch. spikes (spikes), MBR and Ch. bursts (bursts), STTC and DBSCAN STTC (synchrony), and Efficiency and Clustering coeff (connectivity). Feature importance was evaluated by removing (leave-one-out) or leaving (leave-one-in) one group of features. Baseline accuracy of cross-validation was calculated using the 18 features. Error bars represent the mean ± SEM. *P < 0.05, **P < 0.01, ***P < 0.001, ****P < 0.0001 vs accuracy obtained with 8 features (one-way ANOVA, followed by Dunnett’s post hoc multiple comparison test). The figure was created using Microsoft PowerPoint 365 (https://www.microsoft.com/powerpoint) (a), R 4.03 (https://www.r-project.org/) (b), and Graphpad 8.0 (https://www.graphpad.com) (e–j).

