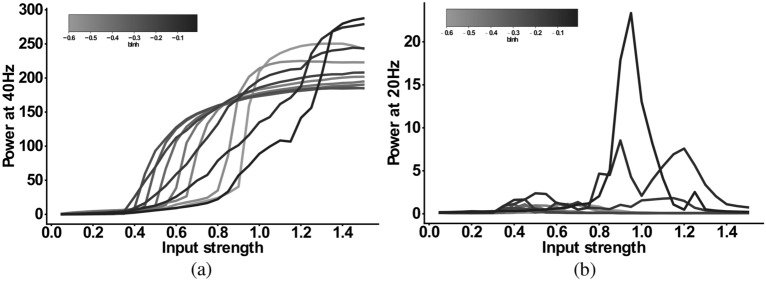
Figure 5.
Input strength dependence of the 20 Hz component ‘IPSC+bInh-SCZ-like’ model. (a) Power at 40 Hz in response to 40 Hz drive as a function of the input strength. (b) Power at 20 Hz in response to 40 Hz drive as a function of the input strength. In both plots the network model has increased IPSC decay times (from 8 to 28 ms) and the interneuron excitability is varied from − 0.01 (black) to − 0.1 (darkest grey) and then in steps of − 0.05 to − 0.6 (lightest grey).

