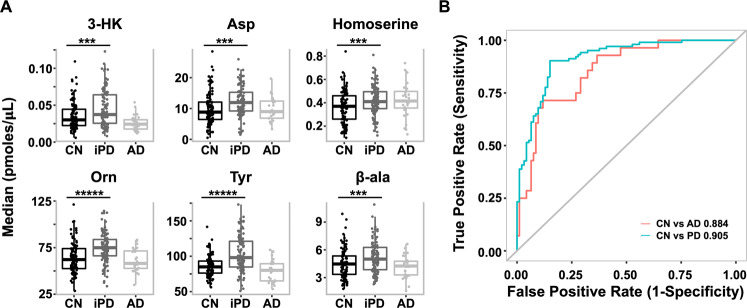
Fig. 1. Elevation of six metabolites in iPD serum.
A Box plot of top six biomarker iPD vs CN and AD (median values in picomoles/µl serum, data taken from Table 1). *** indicates a p value of <0.001 and ***** of <0.00001. B Multivariate ROC analyses resulted in a linear model being able to separate iPD from CN and AD from CN. In the case of iPD vs CN, a panel of seven metabolites resulted in an AUC value of 0.905. For further details, see Table 2C.

