Figure 7.
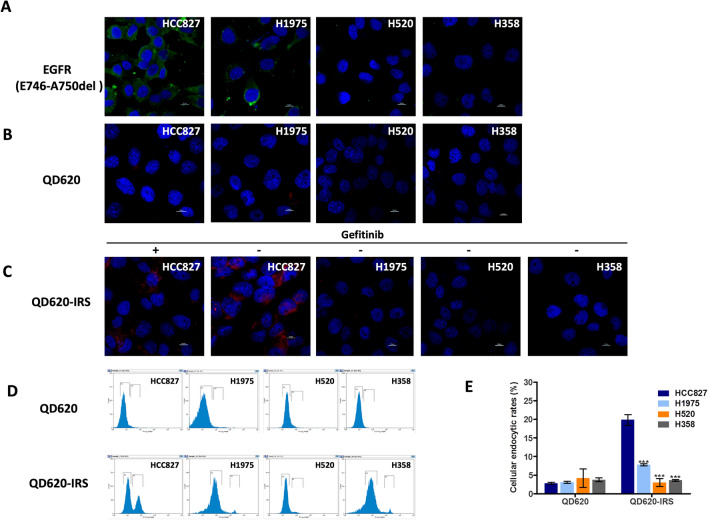
Quantitative analysis of QD620-IRS binding affinity by confocal imaging and flow cytometry. (A) Comparison of the expression levels of EGFR specific E749-A750del mutation in HCC827, H520, H1975 and H358 cell lines by immunofluorescence (Green color is from Alexa Fluor®488 secondary antibody, blue color from DAPI). (B) There is little uptake of QD620 in the four cell lines. (C) QD620-IRS uptake in HCC827 cells expressing EGFR 19 exon deleted mutation is considerably higher than in H1975, H520 and H358 cells. The binding of QD620-IRS in HCC827 cells was inhibited by application of gefitinib (100 μmol/L) (red circle is from QD620-IRS and blue color from DAPI). All scale bars 10 μm. (D) Flow cytometric analysis of endocytic rates in HCC827, H1975, H520 and H358 cells incubated with QD620-IRS or QD620 1 h. In (E), error bars indicate the mean ± S.D. of data from three separate experiments. ***P < 0.001 vs. HCC827 group.

