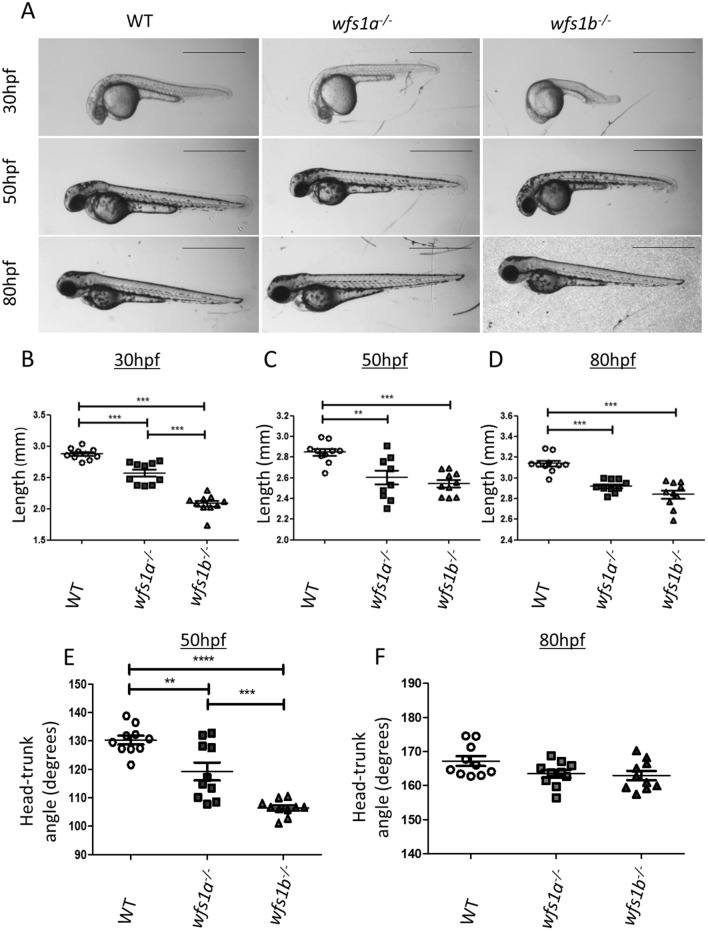
Figure 1.
Phenotypic analysis of wfs1a−/− and wfs1b−/− zebrafish. (A) Zebrafish were imaged at 30, 50 and 80 hpf. Scale bars represent 1 mm. (B–D) Zebrafish length at 30 hpf (B), 50 hpf (C) and 80 hpf (D). (E,F) Zebrafish head-trunk angles at 50 hpf (E) and 80 hpf (F). Zebrafish length and head tail angle was measured using ImageJ and data plots represent mean ± SEM (n = 10). Statistical significance was determined by One-Way ANOVA with Bonferroni multiple comparisons. **p < 0.01; ***p < 0.001; hpf hours post-fertilisation, SEM standard error of the mean.

