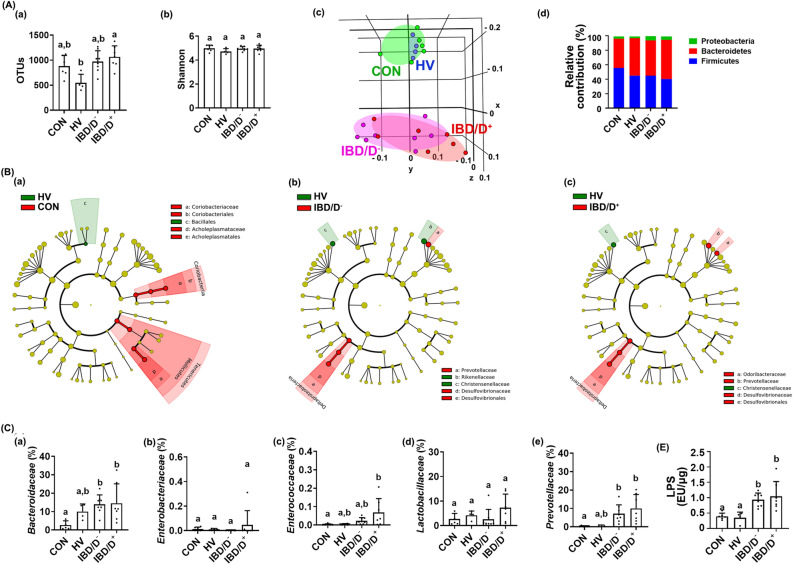
Figure 5.
The fecal microbiota composition of mice orally transplanted with patients with IBD/D− or IBD/D+ and healthy volunteers (HVs). (A) Effects on OTU richness (a), Shannon’s index (b), principal coordinate analysis (PCoA) plot based on Jensen-Shannon analysis (c), and phylum level (d). (B) Effects on gut microbiota composition indicated by Cladogram between the feces of normal control mice (CON) and mice transplanted with HV (a), between the feces of HVs and IBD/D− patients (b) and between the feces of HVs and IBD/D+ patients (c). (C) Effects on the levels of families Bacteroidaceae (a), Enterobacteriaceae (b), Enterococcaceae (c), Lactobacillaceae (d), and Prevotellaceae (e). The gut microbiota composition was analyzed by using using Illumina iSeq 100. (D) Effects on the fecal LPS levels. Data values were indicated as mean ± SD (NC n = 6; HV-F n = 4; IBD/D− n = 8; IBD/D+ n = 7: each n value is the average obtained from 3 mice). Means with same letters are not significantly different (p < 0.05). (A)(a,b), (C)(a,b,d,e), and (D), Kruskal–Wallis test (nonparametric test); (B)(c), ANOVA with Tukey’s multiple comparisons test.

