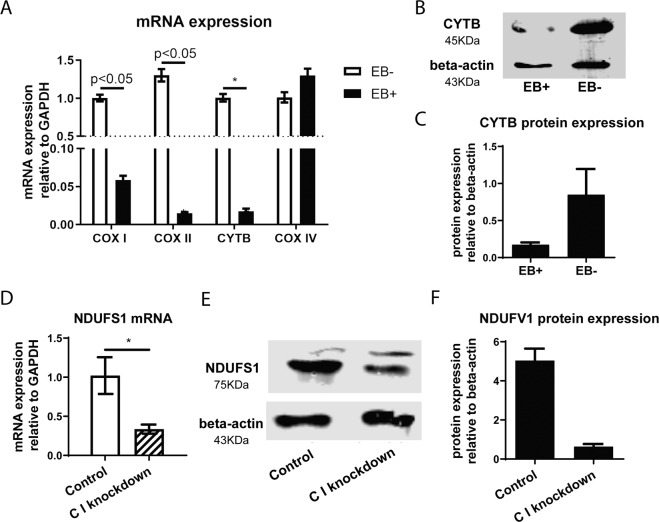
Fig. 3. Establishing the mETC-deficient cell models.
A–C Real-time PCR analysis of COX I, COX II, COX IV and CYTB mRNA (A) (N = 6) and Western blotting analysis of CYTB protein (B, C) (N = 3) in HCC cells after treatment with EB for 5 days. D–F Real-time PCR analysis of NDUFS1 mRNA (D) (N = 6) and Western blotting analysis of NDUFS1 protein (E, F) (N = 3) in HCC cells after transfected with NDUFS1 lentivirus. Results are presented as mean ± SD, group differences were tested by Mann–Whitney U test.

