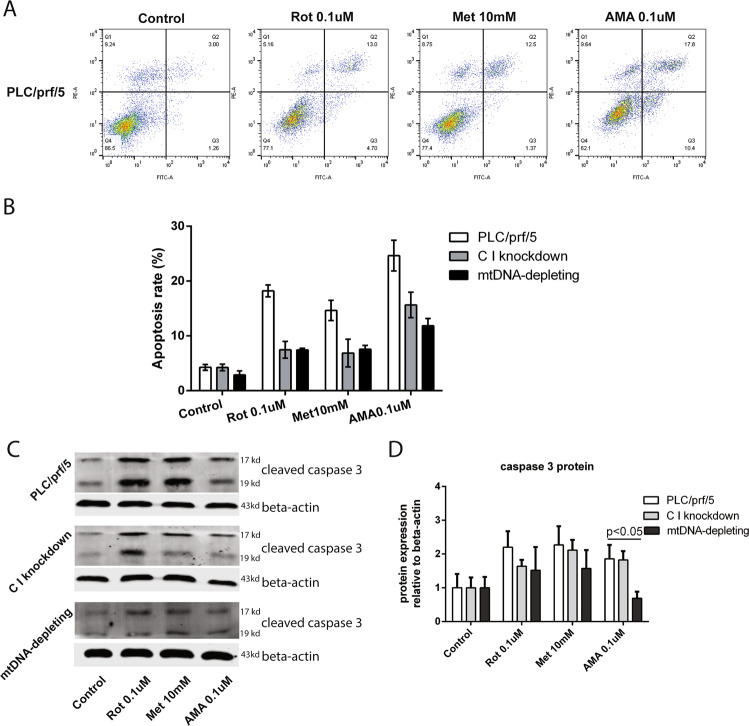
Fig. 5. Inhibition of mETC complexes induced apoptosis.
A Apoptotic cells were quantified by flow cytometry using Annexin V and propidium iodide co-staining in PLC/PRF/5 cells. The effects of treatment with ROT, Met or AMA for 48 h is shown (N = 3). B After treating cells with complex I and III inhibitors (ROT, Met, and AMA) for 48 h, the apoptotic rates of three HCC cell lines (PLC/PRF/5, C I knockdown, and mtDNA depleting) were quantified by flow cytometry. Results were presented as mean ± SD (N = 3). C, D Three conditions (PLC/PRF/5, C I knockdown, and mtDNA-depleted cells) are shown in presence or absence of ROT, Met, and AMA, following a 48 h incubation. The levels of cleaved caspase-3 protein were measured by the Western blotting analysis and quantified by the Image J software. Results were presented as mean ± SD, and group differences were tested by Mann–Whitney U test.

