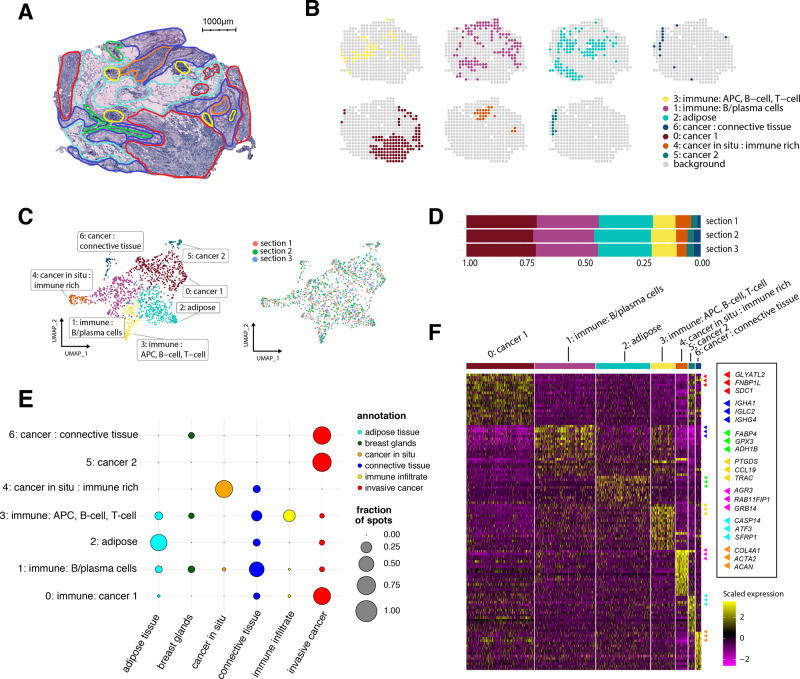
Fig. 2. Results from the expression-based analysis of patient G.
A Morphological regions were annotated by a pathologist into six distinct categories: adipose tissue (cyan), breast glands (green), in situ cancer (orange), connective tissue (blue), immune infiltrate (yellow), and invasive cancer (red). B Split view of each expression-based cluster’s distribution across one tissue section. C UMAP embedding of all spots (n = 446) from the three replicates, markers are colored based on cluster identity. D Proportions of spots assigned to each cluster across the three replicates. E Dot plot showing the overlap between clusters and annotated regions. The size of the dots represents the proportion of cluster spots belonging to an annotated region. The pathologist’s annotations are given on the x axis, cluster annotations on the y axis. F. Heatmap of the clusters and the most highly differentially expressed genes. Each cluster was annotated based on its association with morphological regions and marker genes. Heatmap colors represent normalized and scaled expression values. APC stands for antigen-presenting cell.

