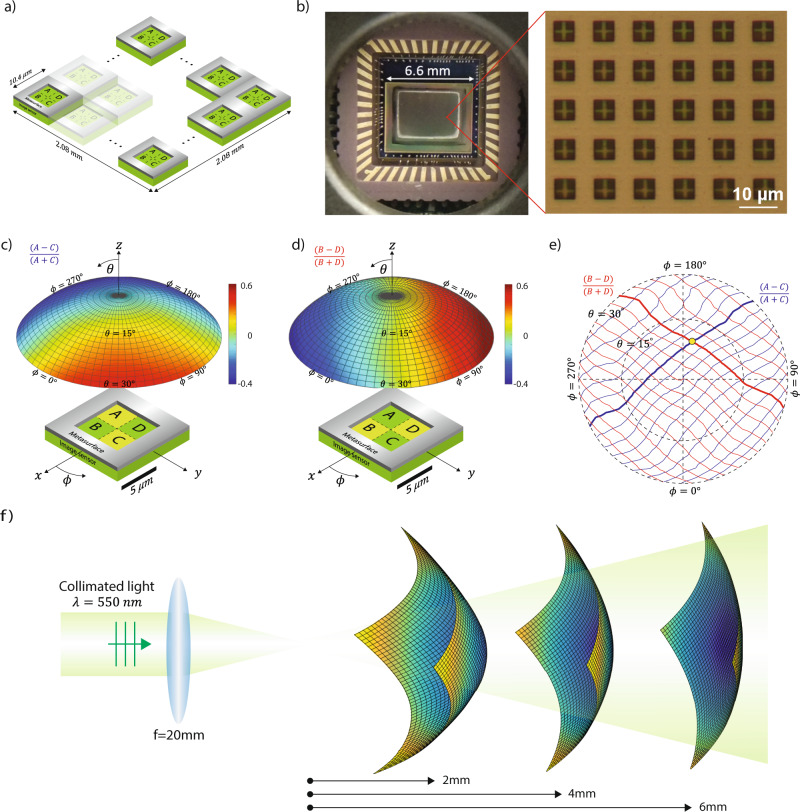
Fig. 3. Wavefront sensor fabrication and characterization.
a Schematic of a wavefront sensor that consists arrays of unit cell. Each unit cell consists of 2 × 2 pixels. b Image of a fabricated wavefront sensor and a microscope image showing its local region where 2 × 2 pixels are partially exposed under each aperture. c Measured pixel intensity ratio of one unit cell as a function of incident angle shown on a hemisphere. Each point on the hemisphere represents one combination of polar angle and azimuthal angle . d Measured pixel intensity ratio of one unit cell as a function of incident angle shown on a hemisphere. e Contour lines extracted from the hemisphere in c and d. A unique incident angle can be determined when two ratios and are measured by the four photodetectors. f Measurement of a diverging wavefront at three different locations that are 2, 4, and 6 mm away from the focal point. Each grid point represents a measured data. It can be seen that the wavefront is characterized at a high spatial resolution.

