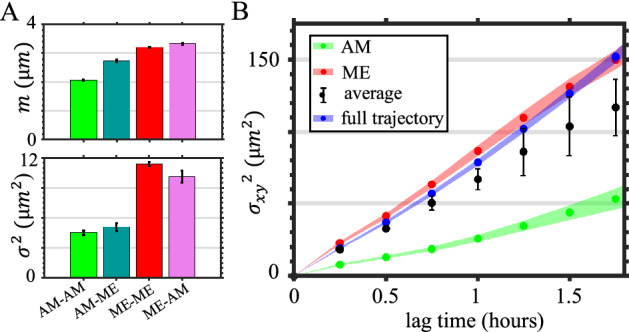
Figure 5.

Cancer cell migration in 3D ECM is coupled with morphological phenotype and phenotype transitions. (A) Means (m, upper panel) and variances (, lower panel) of the step size distributions by fitting the experimental measurements with log-normal distribution. The steps are categorized based on morphological phenotype (coarse-grained as mesenchymal, amoeboidal and intermediate state) dynamics. ME: abbreviation for mesenchymal, which includes FP and LA states. AM: abbreviation for amoeboidal, which includes BB and AE states. If a cell makes a step by starting from AM state to ME state, the step is categorized as an AM-ME step. The starting and ending frames of steps are separated by 15 minutes. In (A) errorbars show the 95% confidence interval of fitted parameters. (B) Real-space (2D projection) mean square displacements (MSD) of cells. AM: the MSD of cells dwelling in the AM state. ME: the MSD of cells dwelling in the ME state. average: the weighted average of mean square displacements of AM, ME, and intermediate dwelling cells. The average is based on the occurrence fraction of AM, ME and intermediate state of cells. Full trajectory: the MSD obtained from entire cell trajectories regardless of the morphological phenotypes. Shaded areas in C show SEM. In (A-B) a total of 1974 hours of single cell trajectories are analyzed. The ECM are prepared at room-temperature with a concentration [col] = 1.5 mg/mL. This figure is prepared with Matlab R2020a (www.mathworks.com) and ImageJ (https://imagej.net).
