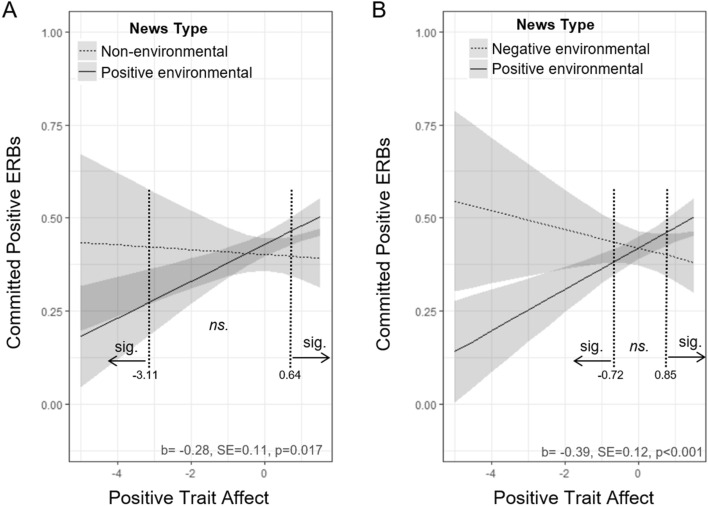
Figure 2.
Trait affect, affective environmental news messages, and pro-environmental behaviors in Experiment 2. (A) Interaction between trait affect and positive versus non-environmental news messages on committed positive ERBs. Vertical dotted lines illustrate where slopes significantly differ from each other as determined by simple slopes analyses (it should be noted that the lower cutoff at − 3.11 represents the bottom 2.2% of all participants). (B) Interaction between trait affect and positive versus negative environmental news messages on committed positive ERBs. Vertical dotted lines again illustrate where slopes significantly differ from each other as determined by simple slopes analyses (it should be noted that the lower cutoff at − 0.72 represents the bottom 18.8% of all participants). All graphs show predicted values, grand mean centered values of trait affect, and 95% confidence intervals as estimated from their respective regression models. ERB = environmentally related behavior.

