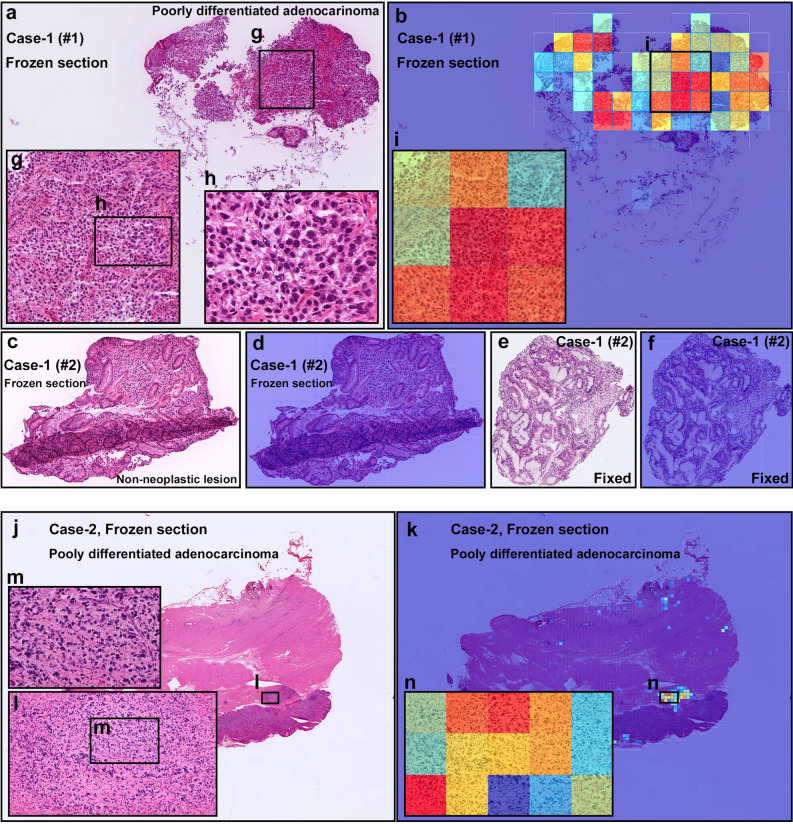
Figure 7.
Representative two cases of frozen section specimens for diffuse-type differentiated ADC. Case-1 consisted of two specimens (#1 and #2). In Case-1 (#1) (a), the heatmap image (b) shows true positive predictions of diffuse-type differentiated ADC cells (g–i). In Case-1 (#2) frozen section specimen (c), there was no cancer cells indicating non-neoplastic specimen which was corresponded to the heatmap image (d). The frozen section (#2) was double-checked after conventional fixation (e). No cancer cells were observed in the fixed specimen as well (e) which was corresponded to the heatmap image (f). In Case-2 (j), the heatmap image (k) shows true positive predictions of diffuse-type differentiated ADC cells (l–n). Model applied at 20, where the 224 224px heatmap square represents 112 112 m.

