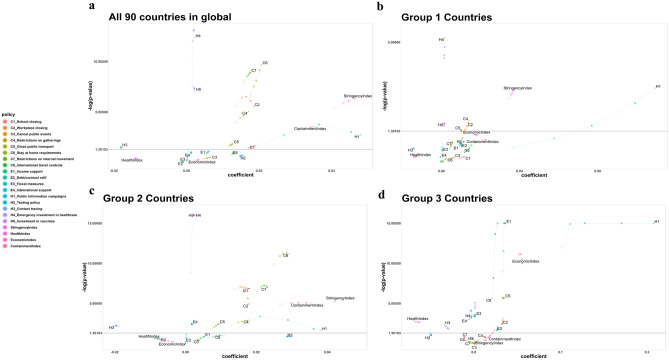
Figure 1.
Lagging effect in the subgroup analysis. Variation of coefficients and p values of policies and indices according to groups is shown. The size and transparency of the circular dots increase with the time lag (0, 3, 7, 10, 14). (a) Analysis of all 90 countries shows C1, C2, C4, C5, C6, C7, H3, H4, H5, SI, and CoI are significant at all time lags. (b) Group 1 analysis shows H4, H5, and SI are significant at all-time lags. (c) Group 2 analysis shows C1, C2, C4, C5, C6, C7, E4, H3, H4, H5, SI, RI, CI, and CoI are significant at all-time lags. (d) Group 3 analysis shows C2, C5, C8, E1, E2, E3, E4, H1, H3, H4, HI, and EI are significant at all-time lags.

