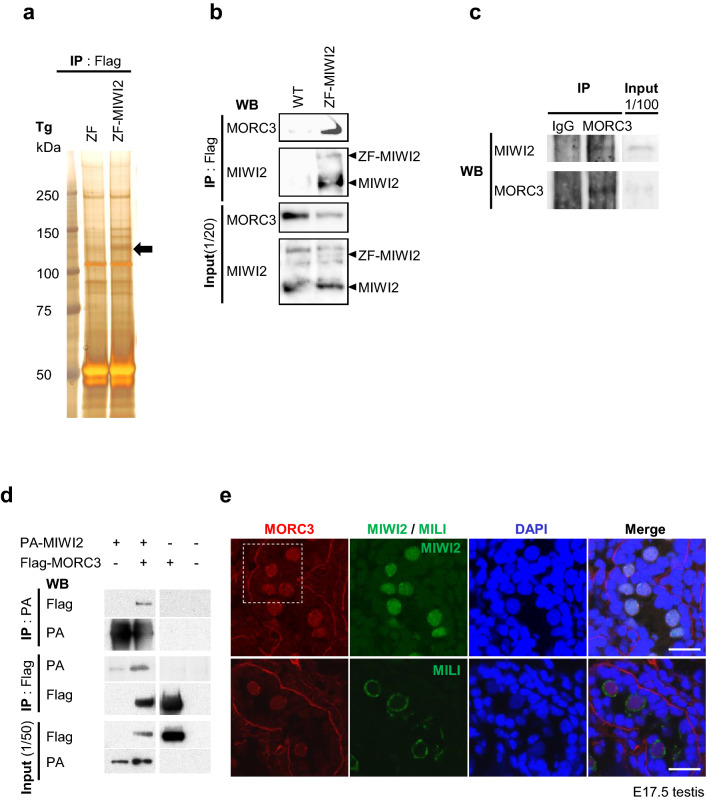
Figure 1.
MORC3 as an interaction partner of MIWI2. (a) Silver staining of the postnatal testis proteins that co-immunoprecipitated with the anti-Flag antibody. Testis lysates of 21-day-old ZF only and ZF-MIWI2 Tg mice were subjected to IP (immunoprecipitation) with the anti-Flag antibody and SDS–PAGE was carried out. The 130 kDa protein that bound specifically to MIWI2 (black arrow) was examined by LC–MS/MS. Uncropped gel was shown in Supplementary Figure S1a. (b) Binding of ZF-MIWI2 to MORC3 in embryonic testes. IP of the embryonic testes lysates of E16.5 wild type and ZF-MIWI2 Tg mice was carried out with the anti-Flag antibody. The immunoprecipitated MORC3, ZF-MIWI2, and MIWI2 proteins were detected using the corresponding antibodies in western blotting. All samples were run on the same gel and transferred. Uncropped blots were shown in Supplementary Figure S1b. (c) Interaction of endogenous MIWI2 to MORC3 in embryonic testes. IP of the embryonic testes lysates of E16.5 wild type mouse was carried out with the anti-MORC3 antibody. The immunoprecipitated MIWI2 and MORC3 proteins were detected using the corresponding antibodies by western blotting. All samples were run on the same gel and transferred. Uncropped blots were shown in Supplementary Figure S1c. (d) In vitro co-IP assays for MIWI2 and MORC3. HEK 293T cells were transfected with the plasmids expressing PA-tagged MIWI2 and Flag-tagged MORC3. The 293T cells were co-transfected with the tagged protein expression constructs. The lysates were immunoprecipitated with the anti-PA or anti-Flag antibodies and subsequently subjected to western blotting with these antibodies. Each of IP : PA, IP : Flag, and input samples was run on the same gel and transferred. Uncropped blots were shown in Supplementary Figure S1d-i. (e) Co-immunostaining of the testes of the E17.5 wild type mice with the anti-MORC3 antibody (red), anti-MIWI2 (green) or anti-MILI (green) antibodies, and DAPI (blue) for DNA are shown. Scale bar, 20 μm. The enlarged images (inside of the white dotted line) are shown in Supplementary Figure S1l.

