Figure 6.
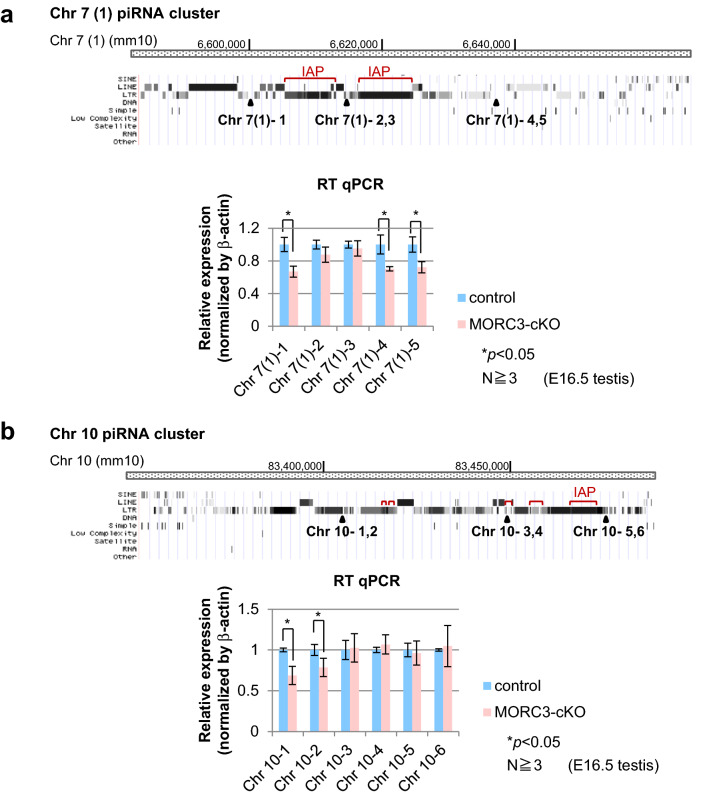
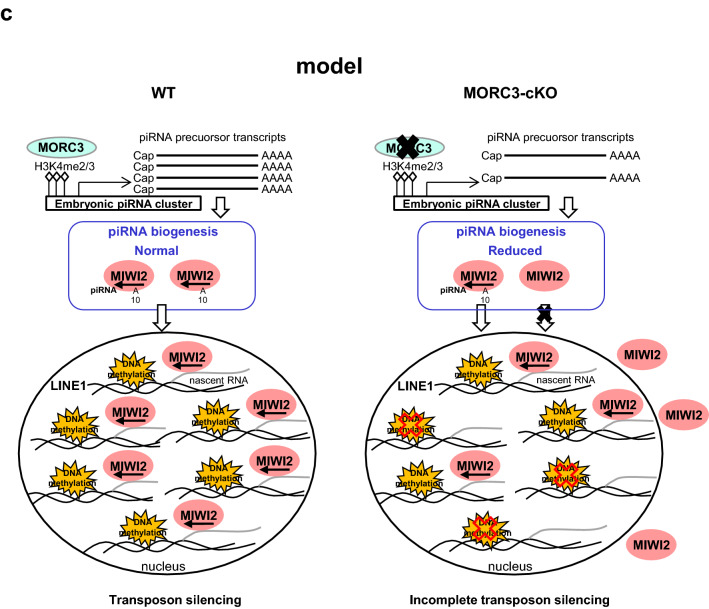
Expression of piRNA precursors from representative embryonic piRNA clusters. (a and b) Structure of the piRNA clusters (Chr 7 (1) and Chr 10) and positions of individual primer sets. The regions of the IAP element sequence in each cluster are described with red bars (from piRBase in UCSC Genome Browser mm10) (upper). Quantitative RT-PCR for the expression analysis of piRNA precursors transcribed from embryonic piRNA clusters using E16.5 wild type and MORC3-cKO embryonic testes (bottom). Data is normalized by β-actin and is shown as means and SD (Error bar) from more than triplicate PCR reactions. Significant differences (*p < 0.05 by the t test) between wild type and MORC3-cKO data using primer sets for the Chr 7 (1)-1, 4, and 5 positions (a) and Chr 10–1 and 2 positions (b) are shown. (c) Schematic diagram of de novo DNA methylation pathway mediated piRNAs biogenesis involved with MORC3.


