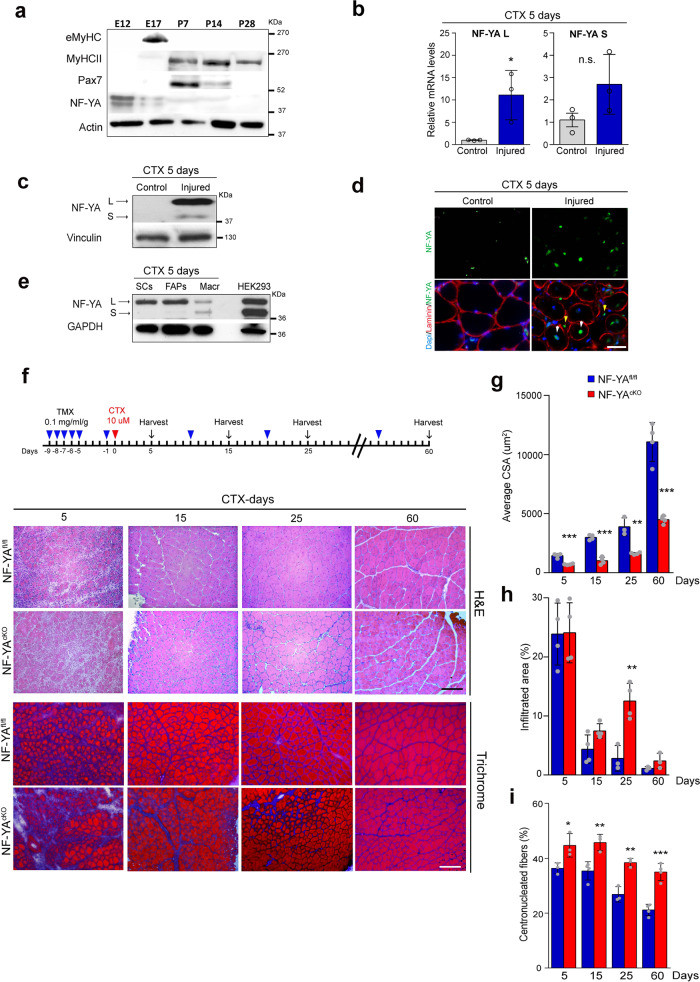
Fig. 1. NF-YA is required for proper regeneration of adult skeletal muscle following injury.
a Western blot analysis of NF-YA protein levels in embryonic (E12), fetal (E17) and post-natal (from P7 to P28) skeletal muscles. MyHCII, eMyHC and Pax7 antibodies were used to follow the myogenic progression. n = 3 experiments. b Relative mRNA levels of NF-YA isoforms (L = long and S = short) in uninjured (control) and 5 days-injured whole TA muscle of WT mice measured by RT-qPCR. Data represent mean ± s.d. (two-tailed unpaired t-test: p = 0.0343; *p < 0.05; n.s. = not significant; n = 3 mice). c Representative immunoblot of NF-YA isoforms (arrows) in uninjured and 5 days-injured whole TA muscle extracts of WT mice. n = 3 experiments. d Immunofluorescence analysis of NF-YA and laminin in TA muscle cross-sections 5 days after CTX injury and uninjured control. White and yellow arrows indicate nuclei of regenerative myofibers and interstitial cells, respectively. n = 3 experiments, scale bar: 50 µm. e Western blot analysis of NF-YA protein expression in sorted satellite cells (SCs), fibro/adipogenic progenitors (FAPs) and macrophage (Macr) cells from CTX-injured TA muscle. Hek293 cell extract was used to mark the different molecular weights of NF-YA isoforms. n = 3 experiments. f Upper panel: Schematic representation of TMX and CTX administration and time-course sample collection. Lower panel: Representative images of H&E and trichrome-stained TA cross-sections of NF-YAcKO compared with NF-YAfl/fl mice at 5, 15, 25, and 60 days after CTX injury. n = 3 mice, scale bar: 100 µm. g Quantification of average cross-sectional area (CSA) (5 days p = 0.0002; 15 days p < 0.0001; 25 days p = 0.0017; 60 days p = 0.002) and h, i percentage of infiltrated area (25 days p = 0.0052) and centronucleated myofibers (5 days p = 0.0380; 15 days p = 0.0082; 25 days p = 0.0034; 60 days p = 0.0003) in TA muscle sections at days 5, 15, 25, and 60 after CTX injection. Data represent mean ± s.d. (two-tailed unpaired t-test was used to calculate the statistical significance: **p < 0.01, ***p < 0.001; n = 4 mice).

