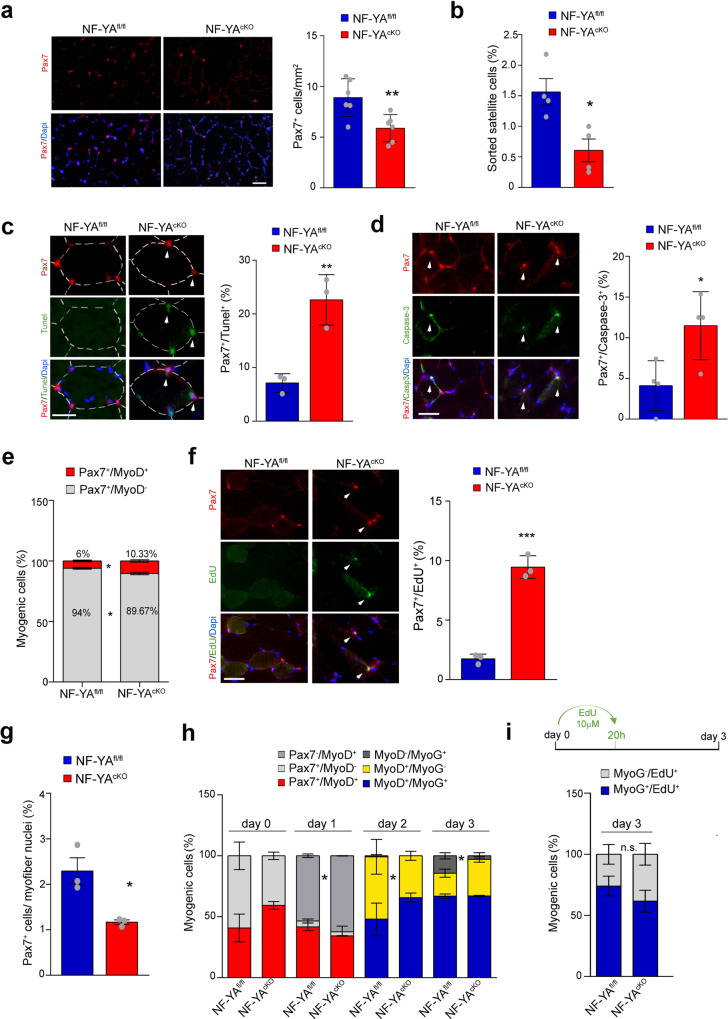
Fig. 4. NF-YA loss reduces satellite cells pool and affects myogenic progression.
a Pax7 immunostaining performed on NF-YAfl/fl and NF-YAcKO TA muscle cross-sections (left panel) and related quantification per mm2 (right panel). Nuclei were identified by DAPI staining. Scale bar: 50 µm. The histogram represents mean ± s.d. (two-tailed unpaired t-test: p = 0.0091, *p < 0.05; n = 6 mice). b Satellite cells were isolated from digested hindlimb muscles of NF-YAfl/fl and NF-YAcKO mice and sorted after incubation with anti-SM/C-2.6 and anti-CD45. SCs positive to SM/C-2.6 and negative to CD45 antigens were normalized on total sorted cells and expressed in percentage. Data represent mean ± s.d. (two-tailed unpaired t-test: p = 0.0158 *p < 0.05, n = 4 experiments). c Left panel: representative images of Tunel (green) and Pax7 (red) positive myonuclei in TA cross sections from NF-YAfl/fl and NF-YAcKO mice. Nuclei were identified by DAPI staining. The arrows indicate double stained cells. Scale bar: 25 µm. Right panel: percentage of Tunel/Pax7 double-positive cells. Data represent mean ± s.d. (two-tailed unpaired t-test: p = 0.005, **p < 0.01; n = 3 mice). d Representative images (left panel) and quantification (right panel) of Pax7/cleaved-Caspase-3 double stained cells in NF-YAfl/fl and NF-YAcKO TA cross sections. Scale bar: 50 µm. Data represent mean ± s.d. (unpaired t-test: p = 0.029, *p < 0.05, n = 4 mice). e Relative quantification of myogenic cells in TA cross sections from NF-YAfl/fl and NF-YAcKO uninjured mice. Data represent mean ± s.d. (two-tailed unpaired t-test: p = 0.0147; *p < 0.05; n = 3 mice). f Left panel: representative images of EdU (green) and Pax7 (red) positive myonuclei in TA cross sections from NF-YAfl/fl and NF-YAcKO uninjured mice. Scale bar: 50 µm. EdU (5 mg/Kg) was injected 24 h before sacrifice. Right panel: percentage of EdU + /Pax7+ cells in uninjured muscles. Data represent mean ± s.d. (two-tailed unpaired t-test: p = 0.0013, **p < 0.01; n = 3 mice). g Quantification of the number of Pax7+ SC nuclei per 100 myofiber nuclei in NF-YAfl/fl and NF-YAcKO muscles. Data represent mean ± s.d. (two-tailed unpaired t-test: p = 0.0190, *p < 0.05; n = 3 mice). h Relative distribution of myogenic cells retained in cultured EDL myofibers at day 0, 1, 2 and 3 post- isolation. Data represent mean ± s.d. (two-tailed unpaired t-test: p values from left to right: p = 0.0142, p = 0.0161, p = 0.0327; *p < 0.05; n = 3 mice). i Relative quantification of myogenic cells after incubation for 20 h with EdU (10 µM), cultured for 3 days from myofibers isolation. Data represent mean ± s.d. (two-tailed unpaired t-test: n.s. = not significant; n = 3 mice).

